Fig. 10
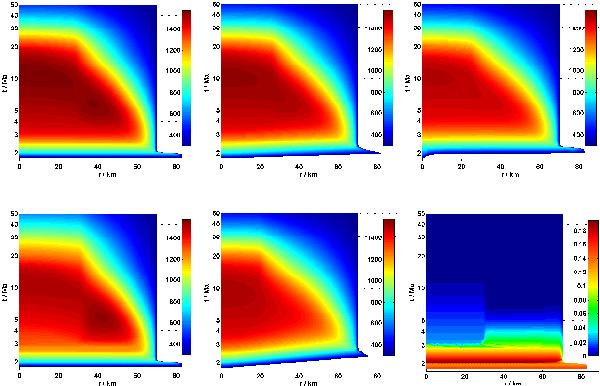
Temporal evolution of the radial distribution of the temperature and of the non-dimensionalised heat source density Q∗. Upper panel: temperature in the cases P3 (left panel), L1 (middle panel) and R1 (right panel). Lower panel: temperature in the cases PL3 (left panel) and L2 (middle panel) and heat source density in the case PL3 (right panel).
Current usage metrics show cumulative count of Article Views (full-text article views including HTML views, PDF and ePub downloads, according to the available data) and Abstracts Views on Vision4Press platform.
Data correspond to usage on the plateform after 2015. The current usage metrics is available 48-96 hours after online publication and is updated daily on week days.
Initial download of the metrics may take a while.