Fig. 8
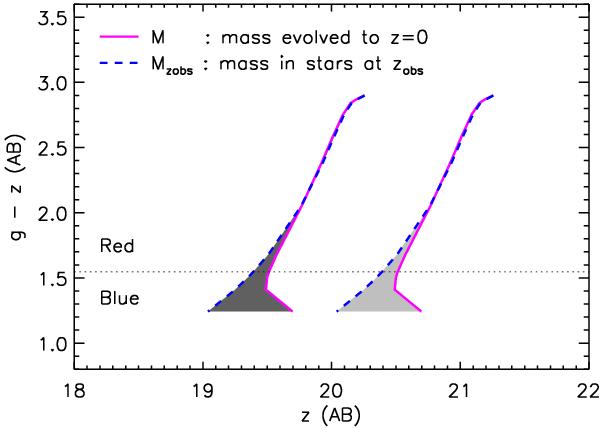
Illustration of a mass bin definition (zobs = 0.49, 10.73 ≤ log (M/M⊙) < 11.13): thick magenta solid lines represent the loci of constant mass M used in this study (the mass evolved to z = 0), thick blue dashed lines the loci of constant mass Mzobs in stars at zobs, and gray shaded areas represent the difference between those two definitions. The horizontal dotted line represents the threshold used to define blue/red galaxies.
Current usage metrics show cumulative count of Article Views (full-text article views including HTML views, PDF and ePub downloads, according to the available data) and Abstracts Views on Vision4Press platform.
Data correspond to usage on the plateform after 2015. The current usage metrics is available 48-96 hours after online publication and is updated daily on week days.
Initial download of the metrics may take a while.