Fig. 6
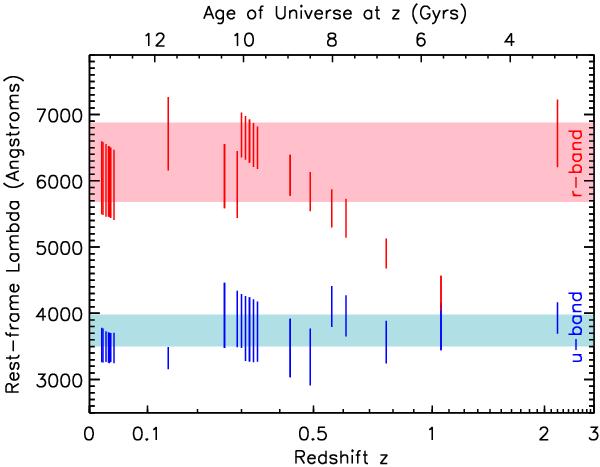
(u − r)-like rest-frame probed color: for each cluster of our sample, we plot the rest-frame probed color as a function of the redshift. The shaded areas indicate the wavelength intervals where the filter response convolved with a typical elliptical galaxy spectrum is above half of its maximum value. The vertical bars represent the same for the redshifts of our clusters and the corresponding chosen filters.
Current usage metrics show cumulative count of Article Views (full-text article views including HTML views, PDF and ePub downloads, according to the available data) and Abstracts Views on Vision4Press platform.
Data correspond to usage on the plateform after 2015. The current usage metrics is available 48-96 hours after online publication and is updated daily on week days.
Initial download of the metrics may take a while.