Fig. 2
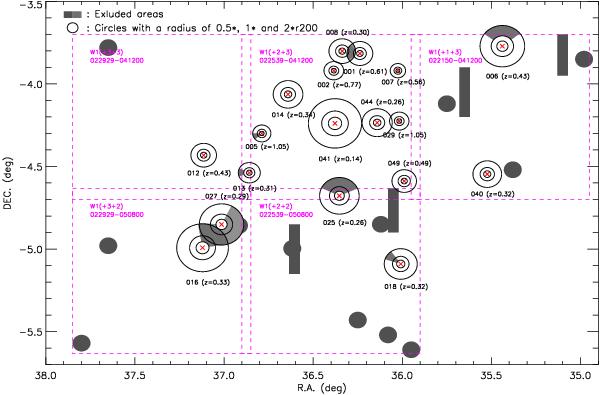
CFHTLS W1 cluster subsample: spatial location of the 18 clusters of our CFHTLS W1 subsample (red crosses). The magenta dashed lines represents CFHTLS W1 fields. For each cluster, blue circles have radii of 0.5 × , 1 × and 2 × r200. Gray areas represent masked regions for fblue estimation and background estimation, due to image corruption (rectangles) or potential clusters at similar redshifts as those of our cluster subsample for each field (disks and sectors).
Current usage metrics show cumulative count of Article Views (full-text article views including HTML views, PDF and ePub downloads, according to the available data) and Abstracts Views on Vision4Press platform.
Data correspond to usage on the plateform after 2015. The current usage metrics is available 48-96 hours after online publication and is updated daily on week days.
Initial download of the metrics may take a while.