Fig. 14
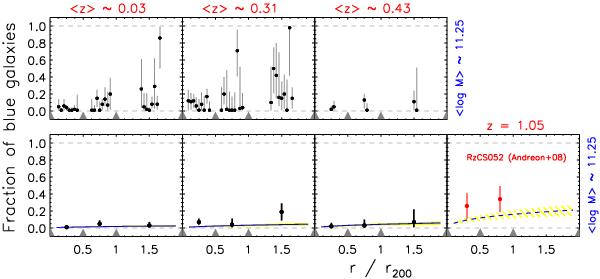
Evolution of fblue for individual (top panels) and stacked (bottom panels) clusters as a function of cluster-centric distance (r/r200) for different bins of redshift (increasing rightward) for a mass-selected sample with a mass corresponding to the original MV in Butcher & Oemler (1984). Symbols are as in Figs. 10 and 11. We add a new panel at z = 1.05 for model prediction, where we overplot the measured values of fblue for the RzCS 052 cluster in Andreon et al. (2008).
Current usage metrics show cumulative count of Article Views (full-text article views including HTML views, PDF and ePub downloads, according to the available data) and Abstracts Views on Vision4Press platform.
Data correspond to usage on the plateform after 2015. The current usage metrics is available 48-96 hours after online publication and is updated daily on week days.
Initial download of the metrics may take a while.