Fig. 13
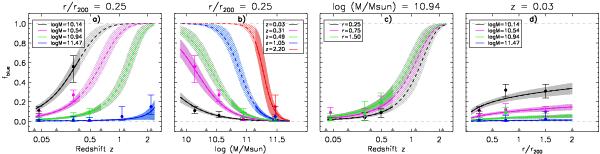
Dependence of fblue on M and z at fixed r/r200 (panels a and b), on z and r/r200 at fixed M (panel c), and on M and r/r200 at fixed z (panel d). Data points with error bars are the same as in Fig. 11. Shaded areas represent the posterior mean and 68% confidence interval of the modeling of Eq. (3), fitting the 225 individual fblue measurements. Prediction/extrapolation of this model for bins where we do not have data are plotted as hatched areas and dashed lines. X-axis bins are indicated by gray filled triangles on the x-axis and horizontal gray dashed lines indicate the minimum and maximum allowed values for fblue.
Current usage metrics show cumulative count of Article Views (full-text article views including HTML views, PDF and ePub downloads, according to the available data) and Abstracts Views on Vision4Press platform.
Data correspond to usage on the plateform after 2015. The current usage metrics is available 48-96 hours after online publication and is updated daily on week days.
Initial download of the metrics may take a while.