Fig. 12
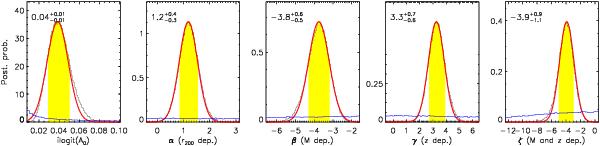
For each parameter fitted with the model of Eq. (3), we plot as a black lines the posterior probability function and as yellow shaded area the shortest interval including 68% of the possible posterior values. We report the point estimate and the 68% confidence interval on each panel, and overplot as a thick red line the corresponding Gaussian curve. The blue lines represent the uniform prior used for the fit.
Current usage metrics show cumulative count of Article Views (full-text article views including HTML views, PDF and ePub downloads, according to the available data) and Abstracts Views on Vision4Press platform.
Data correspond to usage on the plateform after 2015. The current usage metrics is available 48-96 hours after online publication and is updated daily on week days.
Initial download of the metrics may take a while.