Fig. 11
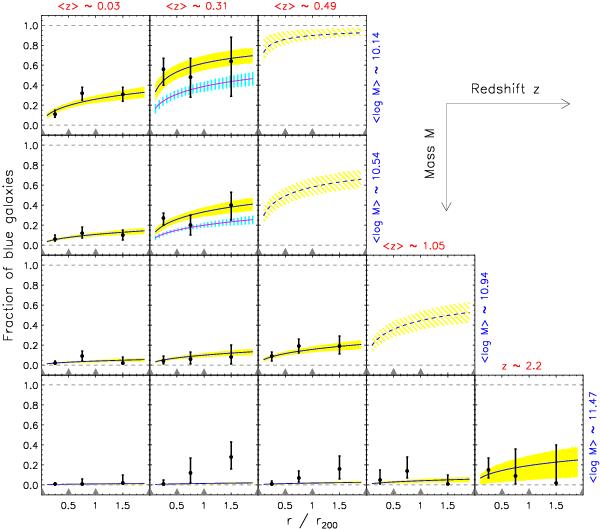
fblue for stacked clusters as a function of cluster-centric distance (r/r200) for different bins of redshift (increasing rightward) and galaxy mass (increasing downward). The computed value of fblue already takes into account the mean aging of stars with increasing redshift by defining the color compared to an exponentially declining SFH model with τ = 3.7 Gyr. Error bars represent the shortest interval including 68% of the possible posterior values for fblue. Radial cluster-centric bins are indicated by gray filled triangles on the x-axis and horizontal gray dashed lines indicate the minimum and maximum allowed values for fblue. Yellow shaded areas with a solid blue line represent the posterior mean and 68% confidence interval of the modeling of Eq. (3), fitting the 225 individual fblue measurements. Yellow slanting hatched areas with a dashed blue line represent the prediction/extrapolation of this model for bins where we do not have data. Cyan vertically hatched areas with solid magenta line (in two panels only) illustrate how the model fit fails if the ζ term in Eq. (3) is not included.
Current usage metrics show cumulative count of Article Views (full-text article views including HTML views, PDF and ePub downloads, according to the available data) and Abstracts Views on Vision4Press platform.
Data correspond to usage on the plateform after 2015. The current usage metrics is available 48-96 hours after online publication and is updated daily on week days.
Initial download of the metrics may take a while.