Free Access
Fig. 17
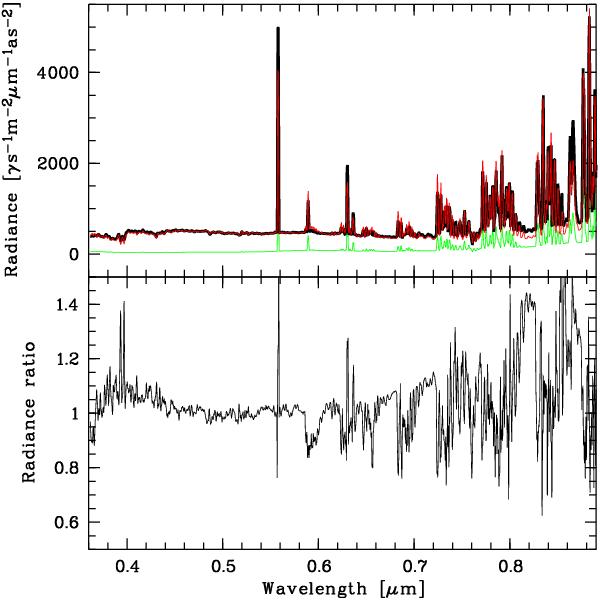
Comparison of the sky model (upper panel: thick black line) and an observed FORS 1 300V spectrum (thin red line) with moderate lunar contribution (see Table 1). The uncertainty of the sky model due to airglow variability is also shown (green). The lower panel exhibits the ratio of the sky model and the observed spectrum.
Current usage metrics show cumulative count of Article Views (full-text article views including HTML views, PDF and ePub downloads, according to the available data) and Abstracts Views on Vision4Press platform.
Data correspond to usage on the plateform after 2015. The current usage metrics is available 48-96 hours after online publication and is updated daily on week days.
Initial download of the metrics may take a while.