Fig. 8
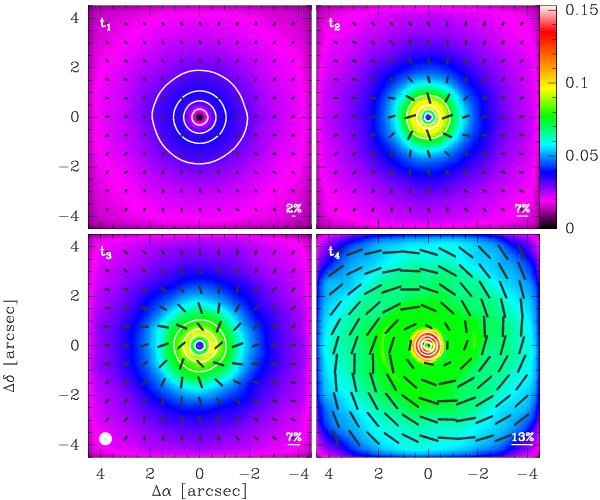
Polarisation maps for a collapsing magnetised dense core (face-on view) obtained with the RAMSES code (rmodel = 6.3 × 10² AU). Labels refer to different times of the collapse: t1 = 1.76 × 10⁴ yr, t2 = 1.86 × 10⁴ yr, t3 = 1.94 × 10⁴ yr, and t4 = 2.96 × 10⁴ yr. White contours show 30, 50, 70, and 90 per cent of the 850-μm dust emission (Stokes I) peak and the scale bar to the right gives Ip in Jy/( beam). See Fig. 1 for further information.
Current usage metrics show cumulative count of Article Views (full-text article views including HTML views, PDF and ePub downloads, according to the available data) and Abstracts Views on Vision4Press platform.
Data correspond to usage on the plateform after 2015. The current usage metrics is available 48-96 hours after online publication and is updated daily on week days.
Initial download of the metrics may take a while.