Fig. 6
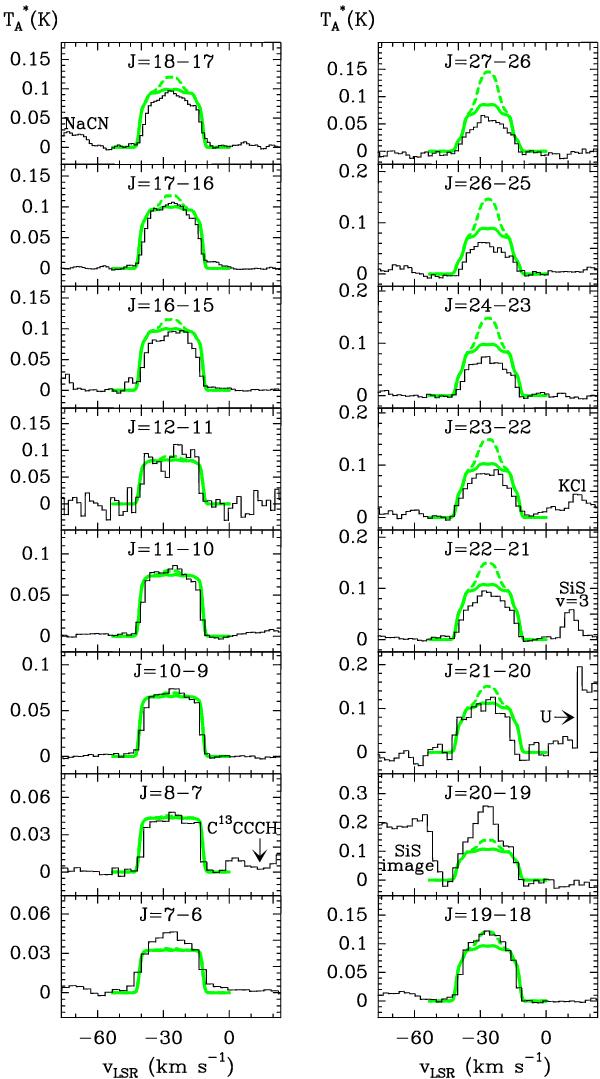
Rotational lines of Na35Cl in IRC +10216 as observed with the IRAM 30-m telescope (black histograms) and as calculated with the radiative transfer model (green lines). Continuous lines refer to the best model, using the abundance profile shown in Fig. 13, while dashed lines result from a model without the abundance decrease in the 1 − 3 R∗ region. Note that dashed lines overestimate the intensity at the center of high-J lines.
Current usage metrics show cumulative count of Article Views (full-text article views including HTML views, PDF and ePub downloads, according to the available data) and Abstracts Views on Vision4Press platform.
Data correspond to usage on the plateform after 2015. The current usage metrics is available 48-96 hours after online publication and is updated daily on week days.
Initial download of the metrics may take a while.