Fig. 4
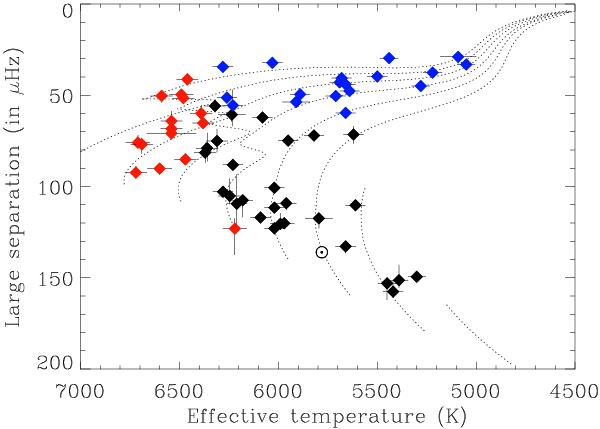
Large separation as a function of effective temperature for the stars in this study; (black) simple stars, (blue) mixed-mode stars, (red) F-like stars, and ( ⊙ ) the Sun. The effective temperatures were derived from Pinsonneault et al. (2012) except where noted in Table 2. The uncertainties in the large separation represent the minimum and maximum variations with respect to the median measured in this study (see Table 2); some of these uncertainties are within the thicknesses of symbols. The dotted lines are evolutionary tracks for stars of mass from 0.8 M⊙ (farthest right) to 1.5 M⊙ (farthest left), in steps of 0.1 M⊙ derived from Christensen-Dalsgaard & Houdek (2010) for solar metallicity.
Current usage metrics show cumulative count of Article Views (full-text article views including HTML views, PDF and ePub downloads, according to the available data) and Abstracts Views on Vision4Press platform.
Data correspond to usage on the plateform after 2015. The current usage metrics is available 48-96 hours after online publication and is updated daily on week days.
Initial download of the metrics may take a while.