| Issue |
A&A
Volume 543, July 2012
|
|
|---|---|---|
| Article Number | A105 | |
| Number of page(s) | 12 | |
| Section | Planets and planetary systems | |
| DOI | https://doi.org/10.1051/0004-6361/201218908 | |
| Published online | 05 July 2012 | |
Chaotic diffusion caused by close encounters with several massive asteroids
The (4) Vesta case⋆
UNESP, Univ. Estadual Paulista, Grupo de dinâmica Orbital e Planetologia, Guaratinguetá, SP, 12516-410, Brazil
e-mail: vcarruba@feg.unesp.br
Received: 30 January 2012
Accepted: 5 June 2012
Context. Close encounters with massive asteroids are known to be a mechanism of dynamical mobility that can significantly alter proper elements of minor bodies, and they are the main source of dynamical mobility for medium-sized and large asteroids (D > 20 km, approximately).
Aims. Orbital mobility caused by close encounters with (4) Vesta has been studied in the past and could be a viable mechanism to produce the current orbital location of some of the V-type asteroids currently outside the Vesta family. It is well known, however, that the proper frequencies of precession of pericenter g and longitude of the node s of terrestrial planets change when one or more of the other planets is not considered in the integration scheme. For instance, the g4 and s4 frequencies are different when the full solar system is considered or when only Mars and the Jovian planets are accounted for. In this work we consider the effect that including one or more (up to 51) massive asteroids in the integration scheme has on the Vesta orbit, and, indirectly on the statistics of changes in semi-major axis caused by close encounters with this massive asteroid.
Methods. By using chaos indicators such as the maximum Lyapunov exponent, and integrations with symplectic integrators able to account for the interaction between a massive asteroid and a mass-less particle, we studied the problem of scattering caused by close encounters with (4) Vesta, when only (4) Vesta (and the eight planets) are considered, and when (4) Vesta and other massive main belt asteroids are also accounted for.
Results. We find that (4) Vesta proper frequencies are dependent on the number of other massive asteroids considered in the integration scheme and that, as a result, the whole statistics of encounters with (4) Vesta is also affected. Variances of the change in proper a caused by the four most massive asteroids varied up to 36.3% in the five integration schemes that we used, and the number of encounters that caused the strongest changes in semi-major axis varied up to a factor 2. The indirect effect caused by the presence of other massive asteroids therefore introduces an additional source of uncertainty in estimating the long-term effect of close encounters with massive asteroids that was not accounted for in previous works on the subject, and that strongly affects estimates of its Hurst exponent.
Key words: minor planets, asteroids: general / minor planets, asteroids: individual: (4) Vesta / celestial mechanics
Appendix A is available in electronic form at http://www.aanda.org
© ESO, 2012
1. Introduction
Orbital diffusion caused by close encounters between small asteroids and one of the major bodies in the main belt, (1) Ceres1, (2) Pallas, (4) Vesta, and (10) Hygiea was already shown to be a mechanism able to produce long-term change in the proper elements of asteroids in the proximity of the orbits of (1) Ceres and (4) Vesta (Carruba et al. 2003, 2007; Delisle & Laskar 2012). The change in semi-major axis, eccentricity, and inclination caused by the long-term effect of close encounters with (4) Vesta may have contributed to the diffusion of some of the V-type asteroids currently outside the Vesta family whose orbits could not be easily explained in terms of migration from the Vesta family caused by other mechanisms, such as diffusion by the Yarkovsky and YORP effects, interaction with mean-motion and secular resonances, or both.
The long-term effect of close encounters studied in previous works was not negligible, but weak, and important only in regions characterized by high collision probabilities with one of the most massive asteroids. Recently, Laskar et al. (2011) showed that when the five major bodies were included in simulations with all the planets, surprisingly, not only the orbits of the major asteroids were more chaotic, but even the precision with which the orbital elements of the Earth are known was limited to 50 Myr. Delisle & Laskar (2012) investigated the orbital mobility in the Vesta family region caused by close encounters with eleven major asteroids, and found that most of the mobility is caused by encounters with (4) Vesta and (1) Ceres, and is on the order of magnitude of what is found in previous works (Carruba et al. 2003, 2007). Delisle & Laskar (2012) estimated that close encounters dominated the orbital mobility of minor bodies with respect to the Yarkovsky and YORP effects only for large objects, with increasingly limited diameters when longer timescales were considered. One question left unanswered by the Delisle & Laskar (2012) paper was on the indirect effect of close encounter with massive asteroids when more than one object was considered. It is well known that the proper frequencies of precession of pericenter g and longitude of the node s of terrestrial planets change when one or more of the other planets is not considered in the integration scheme. For instance, the g4 and s4 frequencies are different when the full solar system is considered or when only Mars and the Jovian planets are accounted for. Is the orbit of the massive asteroid perturbed enough to change the orbital mobility when more than one massive asteroid is considered, or is this indirect effect negligible?
In this work we investigate this question by studying diffusion in proper elements of minor bodies in the region of (4) Vesta i) when the eight planets are considered and ii) when, on top of the eight planets, we also consider the gravitational effect of (4) Vesta and up to 51 other massive asteroids. We also simulated the orbital diffusion of real asteroids in the region caused by both close encounters and the Yarkovsky and YORP effects, and obtained estimates of the Hurst coefficient (Carruba et al. 2007) for timescales of 100 Myr.
This work is structured as follows: in the first section we introduce the problem of dynamical mobility caused by close encounters in the new integration schemes. In the second section we outline our numerical simulation set-ups and the problem of the stability of Vesta proper frequencies when other massive asteroids are considered. In the third section we investigate the chaotic behavior of test particles in the region of (4) Vesta when one or more massive asteroids are considered. In Sect. 4 we study the change in proper semi-major axis caused by diffusion by massive asteroids in the Vesta region for real objects, by using integration schemes that include up to 23 massive asteroids, and study the effect that the presence of other massive asteroids has on the statistics of changes in proper a caused by (4) Vesta and the other three most massive bodies in the main belt. In the fifth section we investigate orbital diffusion on longer timescales when the Yarkovsky and YORP effects are also considered. Finally, in Sect. 6 we present our conclusions.
2. Numerical simulation set-up
Recently, Delisle & Laskar (2012) studied the problem of chaotic diffusion of the Vesta family induced by close encounters with massive asteroids. In their work the authors ran two sets of numerical simulations, one with the eight planets of the solar system plus the Moon and Pluto (simulation S in their notation) and one with the same set-up, but also with 11 numbered massive asteroids (simulation SE in their notation, the asteroids were (1) Ceres, (2) Pallas, (3) Juno, (4) Vesta, (7) Iris, (10) Hygiea, (15) Eunomia, (19) Fortuna, (324) Bamberga, (532) Herculina, and (704) Interamnia). The authors used simulation S as a test-bed for the case when no close encounters are present, and evaluated the diffusion in semi-major axis caused by encounters with the 11 massive asteroids. They found that mobility caused by close encounters in the region of (4) Vesta is dominated by encounters with the two most massive bodies, (1) Ceres and (4) Vesta, with a limited mobility provided by encounters with the other nine integrated massive bodies. According to their results, encounters with massive asteroids are more efficient if a single big object is considered, rather than having several smaller asteroids of equivalent mass. In this work, we plan to investigate the indirect role that close encounters with massive asteroids may have when more than one asteroid is considered. How does the number of encounters with a single massive asteroid changes when more than one massive asteroid is considered? And how does this affect chaotic dynamics in the region? For this purpose, we used several numerical integration set-ups, depending on the number of massive asteroids considered. Among the various set-ups we distinguish: S0: simulation with the eight planets only; S1: simulation with the eight planets plus (4) Vesta; S11: simulation with the eight planets plus the 11 asteroids of Delisle & Laskar (2012); S51: simulation with the eight planets and the 51 main belt asteroids with masses larger than 1 × 10-14 M⊙ for which Baer et al. (2011) obtained recent masses estimates. By comparing the different scenarios we plan to check how the dynamical mobility caused by (4) Vesta only is affected when more massive asteroids are considered, and if the extrapolation of the global effect of close encounters with all the main belt asteroids by Delisle & Laskar (2012) holds.
One important parameter for our simulations is the value of the asteroid masses. Recently Baer et al. (2011) obtained astrometric masses of 61 asteroids, with a new observational error model. Table 3 in their paper reports the astrometric masses of these asteroids with their uncertainties, and the estimates from other authors. To set-up our S51 simulations we used the most recent values of astrometric masses given in that paper. We recall that other authors give results not always in agreement with Baer’s (i.e., lower or higher than Baer’s values plus or minus the uncertainties), as is the case for example of the masses of (1) Ceres, (2) Pallas, (4) Vesta, and (10) Hygiea, among others. For the sake of consistency we will use in this paper only the last recent data from Baer et al. (2011), but results of the integration may vary depending on the mass data used.
Table A.1 summarizes the results from Baer et al. (2011). The first column reports the asteroid name and identification, the second column shows the asteroid mass in solar mass units, the third column the uncertainty, the fourth and the fifth column report the asteroid proper semi-major axis and proper eccentricity, taken from the AstDyS site (http://hamilton.dm.unipi.it/astdys)2. One important parameter when dealing with close encounters with massive asteroids is the asteroid Hill sphere radius. Minor bodies will experience significant changes in proper elements if they entered the Hill sphere of the massive asteroid. For asteroids on highly eccentric orbits such as Pallas it can be numerically shown (Hamilton & Burns 1991) that the stability zone scales roughly as the size of the Hill sphere calculated at pericenter, i.e.: 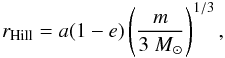 (1)where m is the mass of the asteroid. The last column of Table A.1 shows the value of the Hill sphere radius (in AU) computed with Eq. (1). Asteroids are listed as a function of the mass, from the most massive to the less; asterisks identify objects in the S11 simulation of Delisle & Laskar (2012).
As can be seen in Table A.1, with the exception of (1) Ceres, (2) Pallas, (4) Vesta, and (10) Hygiea, the asteroids originally studied in Carruba et al. (2003), the other bodies all have Hill sphere radii of less than 0.6 × 10⁻³ AU. This may explain the results in Delisle & Laskar (2012): less massive objects have smaller Hill sphere radii and therefore have smaller cross-section with respect to the flux of possible incoming asteroids.
Finally, Krasinsky et al. (2002) estimated the total mass of the main belt as 18 × 10-10 M⊙. Other authors give lower values for the main belt total mass (Fienga et al. 2011, 15 × 10-10 M⊙. Figure 1 shows the fraction of the main belt mass as a function of the number of massive asteroids. The asteroids are ordered as a function of their mass, with (1) Ceres first, whose mass is about 26.45% of the total mass of the main belt. The mass of Vesta accounts for 5.10% of the total asteroid mass according to Krasinsky et al. (2002), while the mass of the 11 asteroids in the S11 simulation accounts for 46.40% of the total mass, and the mass of the 51 asteroids in the S51 simulation accounts for 56.85% of the total.
 |
Fig. 1 Fraction of the main belt mass as a function of the number of massive asteroids in the order given in Table A.1. |
To investigate possible indirect effects caused by the presence of other massive asteroids in the system we obtained the values of the proper frequencies of pericenter and longitude of the node precession g and s for (4) Vesta for simulations involving progressively all 51 asteroids in Baer et al. (2011) paper3, using the frequency modified Fourier transform algorithm of Šidlichovský & Nesvorný (1997). We integrated our asteroids as massive bodies over 30 Myr, using SWIFT-SKEEL, the symplectic integrator using the Wisdom & Holman mapping (Wisdom & Holman 1991; Levison & Duncan 2000).
An important parameter for correctly simulating close encounters with massive asteroids is the integration time-step, which has to be short enough for the integrator not to miss possible encounters among asteroids. For instance, if the time it takes for an asteroid to cross the Hill sphere of (4) Vesta were five days, a simulation using a longer time-step could miss this particular encounter. On the other hand, using a time-step too short may significantly increase the length of the numerical integration, in some cases making it impractical. A trade-off between gaining a complete statistics and the practicability of the numerical integration has to be found.
In this work we are interested mostly in the encounters that occur at low mutual velocities and distances between the perturber and the perturbee, because these are the encounters that cause the strongest change in proper elements, and that dominate the long-term effect of asteroid mobility (Carruba et al. 2007). Also, Delisle & Laskar (2012) showed that changes in proper a are affected by “secular effects”, whose standard deviation is about σa = 2 × 10⁻⁴ AU (see also discussion in Sect. 4). Changes in proper a caused by close encounters to below 3σa are not easily distinguishable from variations caused by other effects. As a first order estimate of the correct time-step needed to find all close encounters that caused a da > 3σa AU, we used the following argument: to cause a da change of 6 × 10⁻⁴ AU, an encounter would have to cause a change in heliocentric velocity δU0 of about 10 m/s (we estimate this using the orbital velocity of Vesta of about 18.3 km s-1 and the relationship δU0 ∗ avesta/vorb = da). The maximum mutual velocity that can cause such a change in heliocentric velocity is 500 m/s (see once again Fig. 5 in Carruba et al. 2007). At this speed the Hill sphere of Vesta will be crossed in about 2.3 d. We believe therefore that a step-size of 2d should be reasonable.
Figure 2 shows the Fourier spectra of pericenter precession frequencies g for (4) Vesta with three integration schemes. The reader may notice that the line associated with the g frequency is much wider in the simulation with 11 and 51 asteroids than in the case with just one asteroid.
 |
Fig. 2 Fourier spectra of pericenter precession frequencies g for (4) Vesta in the S1 simulation (black line), in the S11 (blue dotted line), and in the S51 (red dotted line). On the y-axis we reported the amplitude of the frequency normalized with respect to the g-frequency of (4) Vesta. |
For each of the 51 simulations with massive asteroids we computed the values of the g and s frequencies over four time intervals of 8.192 Myr using the approach of Knežević & Milani (2003). We took the mean of the four values as an estimate of the proper frequencies and the standard deviation as an estimate of the error. Figure 3, panel A, shows how the g frequency of (4) Vesta depends on the number of massive asteroids included in the simulation. Vertical black lines display the error associated with each frequency value, the blue horizontal line shows the mean value of g for all 51 simulations, and the horizontal red lines display the values of frequencies between the mean value minus and plus the standard deviation of the data (we refer to this interval as the “confidence level”).
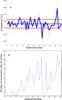 |
Fig. 3 Panel A) dependence of the precession frequency of the Vesta pericenter g on the number N of other massive asteroids included in the simulation. Asteroids are given in the order of Table A.1. Panel B) the number of close encounters with massive asteroids of (4) Vesta as a function of N. |
Quite surprisingly we observe that the proper frequencies of Vesta may change significantly when new massive asteroids are considered in the integration set-up. Changes are in many cases larger than the errors on the proper frequencies computed when (4) Vesta alone is considered, and do not scale out if a larger part of the main belt mass is considered. For instance, the largest difference in the g frequency (results are similar for the s frequency of precession of the longitude of the nodes) is observed as a result of the S47 integration scheme4.
What is the cause of these fluctuations? Figure 3, panel B, shows the number of close encounters with massive asteroids that (4) Vesta experienced in the various integration schemes. While there is no simple correlation between the number of encounters and the changes in the g frequency (encounters with (4) Vesta may occur at high relative velocities and distances, or different encounters may cause a total negligible change in proper elements), we do observe that the strongest changes in g are indeed found when (4) Vesta experienced very many encounters with massive asteroids, as in the S22, S33, and S47 integration schemes. Deep close encounters of massive asteroids with (4) Vesta may therefore significantly change the proper frequencies of this asteroid, so changing the whole orbital history of (4) Vesta and other asteroids. The orbital mobility caused by close encounters with (4) Vesta may therefore also be significantly affected. Verifying the long-term effects of this change is therefore important when assessing the strength of this mechanism of orbital mobility, and will be the subject of the next section.
3. Dynamics in the region of (4) Vesta
To investigate the dynamical mobility caused by close encounters we first integrated 6160 equally spaced particles in the region of (4) Vesta with SWIFT-WHM, the integrator using the symplectic mapping of Wisdom & Holman (1991), under the action of the eight planets and Vesta for 20 Myr. We used 61 intervals in semi-major axis, starting at a = 2.2 AU and with a step of 0.2 AU, and 101 intervals in inclination from zero degrees and a step of 0.1°. The eccentricities and the other angles of the test particles were those of (4) Vesta at J2000. We then obtained synthetic proper elements using the methods described in Knežević & Milani (2003) and Carruba (2010). We use the value of Baer et al. (2011) for the mass of (4) Vesta.
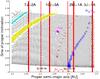 |
Fig. 4 Synthetic proper element map in the (a, sin(i)) plane of the region near (4) Vesta (black dots). Vertical red lines show the location of the main mean-motion resonances. The magenta full dot shows the orbital location of (4) Vesta, the cyan circle shows asteroids to within an arcsec from the center of the z3 secular resonance, yellow circles are associated with test particles near the z2 secular resonance, red circles are associated to the 2ν6 + ν5 − ν16 resonance, and blue circles display the orbital location of the 3ν6 − ν5g-type resonance. |
 |
Fig. 5 Panel A) values of Lyapunov times for particles in the proper (a, sin(i)) plane in the region of (4) Vesta, integrated in the S1 scheme; blue circles are associated with TL < 2000 yr, while yellow circles are related to orbits with 2000 < TL < 10 000. The other symbols are the same as in Fig. 4. Panels B)–D) the same projection, but for particles integrated in the S11, S23, and S51 schemes, respectively. |
In Fig. 4 we show a dynamical map in the domain of proper (a, sin(i)) for the test particles in the region of (4) Vesta. Black dots show the value of proper elements associated with the originally equally spaced initial conditions. The magenta full dot shows the orbital location of (4) Vesta. Vertical red lines are associated with the main mean-motion resonances in the region, which appear as regions of lower number density of test particles. The inclined bands of aligned points are related to secular resonances: the cyan circle shows asteroids to within an arcsec from the center of the z3 = 3(g − g6) + s − s6 secular resonance (g and s are the precession frequencies of the longitude of pericenter and of the argument of the nodes, respectively, and the suffixes 5, 6 etc. refer to the planets Jupiter, Saturn, etc.), yellow circles are associated with test particles near the z2 = 2(g − g6) + s − s6 secular resonance, red circles are associated to the 2ν6 + ν5 − ν16 resonance (where ν6 = g − g6,ν5 = g − g5, and ν16 = s − s6), and blue circles display the orbital location of the 3ν6 − ν5g-type resonance5. Other mean-motion resonances at lower semi-major axis, such as the 2J:6S:-6U:-1A, 4J:1S:-6U:1A, are not shown for clarity.
One can notice a region of lower particle density near (4) Vesta, most likely caused by scattering via close encounters of asteroids in orbits close to (4) Vesta. To study the chaotic dispersion caused by close encounters with massive asteroids we used the maximum Lyapunov exponent (MLE hereafter) of Lyapunov (1907) and Benettin et al. (1980). The MLE (and its inverse, the Lyapunov time TL), is a measure of exponential stretching of nearby orbits. The Lyapunov exponents tend to zero in finite-time calculations for regular orbits, while they assume positive values for chaotic orbits. Lower values of TL indicate enhanced local stochasticity. To estimate MLEs for orbits we used a modified version of SWIFT-LYAP2, a code that integrated the difference equation (Mikkola & Innanen 1999) in the SWIFT package (Levison & Duncan 2000). We refer the reader to Carruba et al. (2004) for the details of the calculation.
We used MLE for the same test particles employed for obtaining the proper element map in the region of (4) Vesta, with the S1, S11, S23, and S51 integration scheme. Figure 5 displays Lyapunov times: blue circles are associated with TL < 2000 yr, while yellow circles are related to orbits with 2000 < σ < 10 000 yr. Overall, the (4) Vesta region is a fairly regular region: when we consider the S1 scheme we observe a chaotic region associated with close encounters occurring at low distances and low relative speeds near (4) Vesta, while the rest of the test particles are fairly regular (Fig. 5, panel A). When we consider the S11 integration scheme (Fig. 5, panel B) one can notice that many particles that were regular previously now have Lyapunov times lower than 10 000 yr, because of close encounters with massive asteroids other than (4) Vesta. More interestingly, the region of deep close encounters near (4) Vesta (blue dots, TL < 2000 yr) is different in shape when ten other massive asteroids are considered. This phenomenon is observed also for the simulation with the S23 and S51 schemes: while the global picture of the region of low Lyapunov times is pretty much constant, details of the shape of this region may differ considerably in the four integration schemes.
To quantify this effect we computed a statistics of particles with short Lyapunov times in the four integration schemes, shown in Fig. 6. The number of objects with very short Lyapunov times, associated to close encounters with (4) Vesta that happened at low relative velocities and small mutual distances, is considerably higher for particles in the simulations with more than one massive asteroid. To check if the statistics of short Lyapunov times are compatible, we performed a one-dimensional Kolmogorov-Smirnov test (KS hereafter) on our S1, S11, S23, and S51 Lyapunov time distributions for Lyapunov times up to 10 000 yr. Given two cumulative distributions SN1(x) and SN2(x), the KS statistics D is given by the maximum value of their absolute difference. For given values of D the probability of the null hypothesis that the two data sets are drawn from the same distribution can be obtained (Press et al. 2001). Using standard statistical terminology, we defined the null hypothesis as the possibility that the data are drawn from the same given distribution. We can reject the null hypothesis if it is associated with a probability lower than a given threshold. The S1 distribution is not compatible with those of S23 and S51 at a 10.0% level, and is not compatible with that of S11 at the relatively high threshold level of 56.0%. The S11 distribution is not compatible with the S23 for a threshold level of 80.0%, and with the S51 at a 90% level. Finally, the S23 distribution is not compatible with the S51 at a threshold level of 99.5%. Our results suggest that there is a non-negligible probability that the presence of other large asteroids may alter the distribution of Lyapunov times, especially when comparing the integration scheme with one massive asteroid with the case when more massive asteroids are considered.
The indirect effect of the presence of more than one massive asteroid on the encounter statistics with (4) Vesta will be studied in more detail in the next sections.
 |
Fig. 6 Histogram of particles with short Lyapunov times in the S1, S11, S23, and S51 integration scheme. |
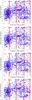 |
Fig. 7 An (a, sin(i)) projection of H < 13.5 asteroids subject to the gravitational influence of all planets plus (4) Vesta (panel S1). Small full blue dots show the location of objects that experienced | da | < 6 × 10⁻⁴ AU or | da | < 3σnoise, and the large red full dots are related to asteroids whose | da | was larger than the 3σnoise. Panels S4, S8, and S11 show the same asteroids, but integrated in the S4, S8, and S11 integration schemes. |
4. Long-term effect of close encounters with massive asteroids
To simulate the long-term effect of close encounters with massive asteroids we used the SWIFT-SKEEL code of the SyMBA package of Levison & Duncan (2000). We first simulated 1829 asteroids under the influence of all planets plus Vesta, and we monitored during the simulation if the distance from (4) Vesta was less than the Hill sphere radius. Since encounters with massive asteroids are important mostly for large objects, as discussed in Carruba et al. (2003, 2007) and in Delisle & Laskar (2012), we only considered objects with absolute magnitude H < 13.5. Using the relationship (Bowell et al. 1989)  (2)where pV is the geometric albedo, equal approximately to 0.05 for typical C-type objects, and 0.2 for typical S-type objects (Masiero et al. 2011), we find that this absolute magnitude corresponds to diameters of approximately 11.86 km for C-type objects and 5.93 km for S-type objects; diameters like these still in the regime where orbital mobility caused by close encounters is still not negligible when compared with the mobility caused by the Yarkovsky effect (the equivalence of the two effect happens for D = 19 km on timescales of 250 Myr, according to Delisle & Laskar 2012). We simulated 1829 real asteroids in the same range of a and i of our dynamical maps, i.e., 2.2 < a < 2.5 AU and 0 < sini < 0.2.
To numerically check if our choice of a two-day time-step size was acceptable, we integrated with SWIFT-SKEEL over 30 Myr 279 asteroids with H < 13.5 in the region of (4) Vesta as defined above with four time-steps: 0.25, 0.5, 1, and 2 days. We found 123 encounters in the first simulation, 81 in the second, 60 in the third, 21 in the fourth. However, the number of encounters that caused the strongest changes in proper a (da > 6 × 10⁻⁴ AU) remained constant (6 in all cases). By using a time-step of two days, we will therefore probably lose several encounters that happened at high relative speed and mutual velocities higher than 500 m/s (see discussion in Sect. 2), but the effect on changes of proper semi-major axis of these encounters will be less than our cut-off value of 6 × 10⁻⁴ AU, as suggested by our numerical experiment. Since the long-term effect on orbital mobility caused by close encounters is dominated by these encounters, we believe that using a 2 d step-size is a reasonable trade-off.
Once we decided on the most appropriate time-step for the simulations with SWIFT-SKEEL, we computed for each of the observed encounters during the simulation the change in position and velocity of the particle with respect to the invariable plane of the solar system, and the changes in proper semi-major axis. To compute the latter we followed the procedure discussed in Delisle & Laskar (2012): we computed the average of the osculating semi-major axis over 200 Kyr and the change in proper a was given by the difference in the value of proper a before and after the encounter. We integrated our asteroids over 30 Myr and used the S0 simulation to estimate the noise in the change in proper a caused by secular effect. Following Delisle & Laskar (2012), if we assume that close encounters are independent events, every fragment undergoes a random walk and after N encounters, the total variance is multiplied by a factor N: ![\begin{equation} {\sigma}_a^2[N] = N {\sigma}_a^2[1]. \label{eq: var} \end{equation}](/articles/aa/full_html/2012/07/aa18908-12/aa18908-12-eq54.png) (3)This gives a measure of the average diffusion resulting from N encounters with the considered asteroid. Since the Bienaymé formula states that the variance of the sum (or the difference) of uncorrelated random variables is the sum of their variances, the variance in jump sizes obtained from a numerical simulation with massive asteroids will be the sum of the variance of the real diffusion and the variance of the noise. Therefore the real diffusion resulting from close encounters will be given by
(3)This gives a measure of the average diffusion resulting from N encounters with the considered asteroid. Since the Bienaymé formula states that the variance of the sum (or the difference) of uncorrelated random variables is the sum of their variances, the variance in jump sizes obtained from a numerical simulation with massive asteroids will be the sum of the variance of the real diffusion and the variance of the noise. Therefore the real diffusion resulting from close encounters will be given by ![\begin{equation} \overline{{\sigma}}_a^2[1]={\sigma}_a^2[1]-{\sigma}_{\rm noise}^2[1]. \label{eq: noise} \end{equation}](/articles/aa/full_html/2012/07/aa18908-12/aa18908-12-eq55.png) (4)We used the results of the S0 simulation to estimate the value of the variance caused by the noise. To analyze the effect of close encounters with massive asteroids, we first used our S1 integration scheme of Sect. 2, and then integrated the same asteroids with the S4 scheme of Carruba et al. (2003), with the S11 scheme of Delisle & Laskar (2012), and with the S8 and S12 schemes of Sect. 2, which are the schemes with the lowest number of asteroids for which the g frequency of (4) Vesta is closest and farther with respect to the mean value, respectively.
(4)We used the results of the S0 simulation to estimate the value of the variance caused by the noise. To analyze the effect of close encounters with massive asteroids, we first used our S1 integration scheme of Sect. 2, and then integrated the same asteroids with the S4 scheme of Carruba et al. (2003), with the S11 scheme of Delisle & Laskar (2012), and with the S8 and S12 schemes of Sect. 2, which are the schemes with the lowest number of asteroids for which the g frequency of (4) Vesta is closest and farther with respect to the mean value, respectively.
Figure 7, panel S1, shows an (a, sin(i)) projection of the real asteroids (black dots) that we integrated in our S1 simulation. We computed the dispersion of changes associated with close encounters in the S0 scheme (the “noise” associated with secular effects) and we found a value of the standard deviation equal to σnoise = 1.88 × 10⁻⁴ AU ≃ 2 × 10⁻⁴ AU. Since the stronger changes in proper a (identified as da hereafter) are those that i) are more significant for the dynamical mobility caused by close encounters with massive asteroids (Carruba et al. 2003), and ii) are those that are less likely to be caused by secular effects, we concentrated our attention on the values of da > 3σnoise = 6 × 10⁻⁴ AU. Small full blue dots show the location of objects that experienced | da | values below 3σnoise, and the large full red dots asteroids with | da | > 3σnoise. The magenta full dot identifies the position of (4) Vesta. There was a total of 5791 close encounters during this simulation, 86 of which with | da | > 3σnoise, and 94 asteroids experienced two repeated close encounters with Vesta. One can notice that the close encounters that caused the strongest changes in semi-major axis (blue and red dots) are not necessarily limited to the region of the Vesta family but can be observed in the Flora and Massalia family region, too. This may be explained by the fact that, in spite of small inclination diferences, bodies from the Flora and Massalia region may still have higher collision probabilities with (4) Vesta than those from its zone, provided that the encounters occur near the pericenter or apocenter lines of both objects. The amount of change in proper elements therefore really depends on the mutual geometry of the two orbits and not on “proximity” in the proper element space.
We then repeated our simulation using the S4 scheme, and Fig. 7, panel S4, shows our results. We used the values of the mean and standard deviation obtained with the S1 simulation to identify blue, green, and red dots. Surprisingly, one can notice that i) the total number of close encounters, 2590, was different from the S1 simulation, ii) the orbital location of the asteroids that experienced close encounters with (4) Vesta only was also different with respect to the previous case, and (iii) there was a different number (50) of objects that experienced a | da | > 3σnoise (to be succinct, we will identify these objects as “red dot asteroids” hereafter), with respect to the four cases observed in the S1 simulation. A similar situation is observed also for the S11 simulation (2423 close encounters with (4) Vesta), and 49 “red dot asteroids”), and for the S8 and S12 simulations (2596 and 2538 close encounters with (4) Vesta, and 49 and 39 “red dot asteroids”, respectively, for the sake of briefness, we do not show results for the S12 simulation in Fig. 7). We chose the S8 and S12 integration schemes because they were the ones for which (4) Vesta proper frequencies had values with the maximum and minimum spread with respect to the mean of the 51 values determined in Sect. 2, respectively. As found in Delisle & Laskar (2012), we confirm that 99% of the total diffusion in variance for the S11 simulation is caused by (4) Vesta and (1) Ceres.
Our results showed that close encounters with (4) Vesta are dependent on the integration scheme that is used, and that an asteroid that experienced a close encounter in the S1 scheme is not going necessarily to experience a close encounter when more than a massive asteroid is considered. The number of close encounters is also not constant when different integration schemes are used. A natural question that arises is on the statistics of close encounters with (4) Vesta and other massive asteroids: how much is the probability distribution function affected when different integration schemes are considered, and how does this reflect on our understanding of chaotic mobility caused by close encounters with massive asteroids?
To answer this question we studied the statistical distribution of encounters with single massive asteroids in our simulations. Since the probability distribution function of changes in proper elements caused by close encounters with massive asteroids is not Gaussian, but characterized by asymmetries and by tails of rather big changes in a associated with encounters occurring at low relative mutual velocities and distances between the massive asteroid and the particle (Carruba et al. 2007), for each distribution of changes in proper a we computed not only ![\hbox{$\overline{{\sigma}}_a^2[1]$}](/articles/aa/full_html/2012/07/aa18908-12/aa18908-12-eq60.png) using Eq. (4), but also the third and the fourth standardized moments, i.e. the skewness γ1 and the kurtosis γ2.
using Eq. (4), but also the third and the fourth standardized moments, i.e. the skewness γ1 and the kurtosis γ2.
The skewness is a measure of the asymmetry of the probability distribution of a real-value random variable. The skewness value can be positive or negative, or even undefined. Qualitatively, a negative skewness indicates that the tail on the left side of the probability density function is longer than the right side and the bulk of the values (possibly including the median) lies to the right of the mean. A positive skewness indicates that the tail on the right side is longer than the left side and the bulk of the values lies to the left of the mean. A zero value indicates that the values are relatively evenly distributed on both sides of the mean, typically but not necessarily implying a symmetric distribution.
Numbers of encounters, moments, and Hurst exponents of the da distribution caused by close encounters with massive asteroids.
The kurtosis is any measure of the “peakedness” of the probability distribution of a real-value random variable. A high kurtosis distribution has a sharper peak and longer, fatter tails, while a low kurtosis distribution has a more rounded peak and shorter, thinner tails. Distributions with zero-excess kurtosis are called mesokurtic, or mesokurtotic. The most prominent example of a mesokurtic distribution is the normal distribution family, regardless of the values of its parameters. A distribution with positive excess kurtosis is called leptokurtic, or leptokurtotic. “Lepto-” means “slender” in Greek. In terms of shape, a leptokurtic distribution has a more acute peak around the mean and fatter tails, as is the case for the distribution of changes in proper elements caused by close encounters with massive asteroids. A distribution with negative excess kurtosis is called platykurtic, or platykurtotic. “Platy-” means “broad” in Greek. In terms of shape, a platykurtic distribution has a lower, wider peak around the mean and thinner tails. Examples of platykurtic distributions include the continuous or discrete uniform distributions. Finally, “Meso-” means middle in Greek. The classical example of mesokurtic or mesokurtotic distribution is the Gaussian distribution. For more information on skewness and kurtosis, we refer the reader to Joanest & Gill (1998).
Table 1 shows the values of , skewness, and kurtosis for the distribution of changes in proper a caused by (1) Ceres, (4) Vesta, (2) Pallas, and (10) Hygiea, the four most massive asteroids, in the S1, S4, S11, S15, and S23 integration schemes. We also report the mean value of each quantity with its error, computed as the standard deviation. One can notice that the number of encounters6, the number of encounters with | da | > 3σnoise, and the moments of the distributions of changes in a fluctuates, sometimes considerably, when different integration schemes are considered. If, for instance, we consider the case of | da | > 3σnoise changes caused by (4) Vesta, the number of encounters that caused strong changes in semi-major axis went from a minimum of 39 in the S12 simulation to a maximum of 86 in the S1. This is a change by a factor ≃ 2.2. One can also notice the considerable variations in skewness for the distribution in da for (10) Hygiea (we went from negative skewness to positive, with changes in the whole symmetry of the distribution) and in the kurtosis of the distributions, with changes in the parameter of up to a factor 2.
Table 1 also reports the mean and standard deviation of the number of encounters and moments of the distribution. We can notice that (i) the standard deviations in the variances of the changes in a may be significant, as for the case of (4) Vesta (36.3% of the mean value) or for (10) Hygiea (82.9% of the mean value); ii) most of the skewness γ1 are compatible, within the errors, with a symmetric distribution, with a possible slight predominance of positive changes in a with respect to negative changes, and iii) while there are high fluctuations in the values of kurtosis γ2, all values indicate that the distribution of changes in a is dominated by “fatter” tails of strong changes.
Finally, an important parameter when analyzing the long-term effect of close encounters with massive asteroids is the Hurst exponent (Carruba et al. 2007). The Hurst exponent T gives a measure of how much each step in the diffusion process does or does not depend on previous steps. For T = 0.5, the motion is uncorrelated and we have the typical one-dimensional Brownian motion. For T > 0.5 the process is said to be correlated and persistent: each data value is related to some number of preceding values. Values of T in the range between 0 and 0.5 are for data series that are anti-persistent: each data value is more likely to have a negative correlation with preceding values.
To estimate this quantity at each 10 Myr we computed the variance of changes in proper a, , using the approach discussed in the previous section, caused by the encounters with (4) Vesta, the asteroid for which the statistics also includes encounters that occur at short relative distances and velocities between the perturber and the perturbee. We then estimated the Hurst exponent of the changes in . We assumed that this quantity could be fitted by a power law of the time of the form  = Ct^{T}, \label{eq: hurst} \end{equation}](/articles/aa/full_html/2012/07/aa18908-12/aa18908-12-eq94.png) (5)where C is a constant. Previous works (Carruba et al. 2003) found values of T for diffusion caused by close encounters with (1) Ceres for members of the Adeona and Gefion families of about 0.58 − 0.72, which suggested that scattering by close encounters was a correlated and persistent process. No such estimate was yet available for the region of the Vesta family. Here we used the three values of
(5)where C is a constant. Previous works (Carruba et al. 2003) found values of T for diffusion caused by close encounters with (1) Ceres for members of the Adeona and Gefion families of about 0.58 − 0.72, which suggested that scattering by close encounters was a correlated and persistent process. No such estimate was yet available for the region of the Vesta family. Here we used the three values of $}](/articles/aa/full_html/2012/07/aa18908-12/aa18908-12-eq97.png) computed at each 10 Myr to determine the T value. Results, reported in the last column of Table 1 are in the same range, within the errors, with values of H previously found for the Adeona and Gefion families.
computed at each 10 Myr to determine the T value. Results, reported in the last column of Table 1 are in the same range, within the errors, with values of H previously found for the Adeona and Gefion families.
To check to up to which point the different distributions of changes in a caused by each massive asteroid in the different integration schemes are compatible, we performed KS tests for each of the observed distributions. We limited our analysis to values of | da | > 3σnoise, to minimize the effect of changes in a caused by secular effects. Figure 8 shows histograms of the changes in proper a caused by (4) Vesta, the main perturber in the region. Each line refers to the results obtained in different integration schemes, according to the figure legend. We used a bin size in a of 10-4 AU, starting from 1.7 × 10⁻³ AU.
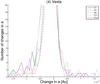 |
Fig. 8 Histograms of changes in proper a caused by (4) Vesta in the S1, S4, S8, S11, and S12 integration schemes. |
We found that the distributions of changes in a for | da | > 3σnoise in different integration schemes are all compatible at a 90% level or higher for the histograms of (1) Ceres and all the other massive asteroids that we considered, but that there are significant differences for the distributions caused by (4) Vesta. In particular, the S1 distribution is not compatible with that of S8 and S11 at a 22% confidence level, and that of S4 is not compatible with the S11 at a 49% confidence level. Since strong changes in a are more likely to happen if the orbital distance between perturber and perturbee is small, as is the case for most asteroids in the area with (4) Vesta, we believe that the fact that our KS results show that | da | > 3σnoise distributions obtained with different integration schemes are not necessarily compatible may be an indication that the presence of massive asteroids other than (4) Vesta may be significant on the long-term effect of orbital diffusion caused by (4) Vesta.
5. Close encounters with massive asteroids when the Yarkovsky and YORP effect are considered
In the previous section we analyzed the orbital diffusion caused by close encounters with massive asteroids when non-gravitational forces such as the Yarkovsky and YORP effects are not considered. Here we further investigate the subject when these effects are taken into account. For this purpose we uses the São Paulo (SP) integrator of Carruba et al. (2007), which is able to simulate both close encounters with massive asteroids and the Yarkovsky effect. We refer the reader to that paper for a treatment of the integrator and of the Yarkovsky effect. Here we just point out that we used the Vokrouhlický model (Vokrouhlický 1999) for the diurnal and seasonal versions of the Yarkovsky effect, so that the drift rate in semi-major axis is given by 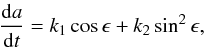 (6)where k1 and k2 are functions depending on the surface thermal parameters and the size, and ϵ is the spin axis obliquity (see Vokrouhlický 1999) for the exact expressions of the k1 and k2 functions). In this work we integrated 1829 real asteroids with H < 13.5 in the region of the Vesta family over 30 Myr with two spin obliquities, ϵ = 0° and ϵ = 180°, which maximizes the drift caused by the diurnal version of the Yarkovsky effect. We computed the radius of each objects using its absolute magnitude and a geometric albedo equal to 0.1, a value typical for S- and V-type objects, using Eq. (2), and we used Yarkovsky parameters typical for V-type objects, the spectral type of most of the members of the Vesta family: a thermal conductivity K = 0.01 W/m/K (Delbo et al. 2007), a thermal capacity of 680 J/kg/K, a surface density of 1500 kg/m3, a bulk density of 2500 kg/m3, a Bond albedo of 0.1 and a thermal emissivity of 0.95 (see also Carruba et al. 2003, for a more in-depth discussion of these parameters).
Following the approach of Delisle & Laskar (2012) we assumed that the obliquity remains constant during a YORP cycle, with maximal values of ϵ = 0° or ϵ = 180°, which yields a maximum strength for the diurnal version of the Yarkovsky effect and a minimal strength for the seasonal one, and that reorientations act almost instantaneously at the end of each YORP cycle, assumed with a timescale of 30 Myr for km-sized objects (Delisle & Laskar 2012). We integrated our real asteroids using our S1 and S0 integration schemes (the latter was used to estimate the values of σnoise, as discussed in the previous section), and we used the values of the standard deviations on the moments obtained in the previous section to estimate the possible errors associated with the particular integration scheme used in this work.
As in the previous section, we used the three values of computed at each 10 Myr to determine the T value of the Hurst exponent, but, with respect to previous works, we also account for the uncertainty associated with changes in between integrations with different schemes. Assuming that errors in are on the order of the standard deviations found in Sect. 4 for (4) Vesta, i.e. 36.3% of the mean value, we can estimate the value of Tand its error using standard techniques of linear regression (see Press et al. 2001, Eqs. (15.2.4), (15.2.6) and (15.2.9)).
Hurst exponents for clones of real H < 13.5 asteroids.
Table 2 shows values of the T coefficient for (4) Vesta for (i) the simulation with clones of real asteroids with initial zero obliquity, (ii) the simulation with clones of real asteroids with ϵ = 180°, and iii) for all asteroid clones. While the T values that best fitted our data are still compatible with scattering with massive asteroids being a persistent and correlated process, unfortunately, the uncertainties are so large that no final conclusions can be positively achieved. Previous values of Hurst exponents found in the literature, which do not account for the uncertainties in standard deviations and variances in a caused by the indirect effect of the presence of other massive asteroids, should therefore be considered with some caution.
6. Conclusions
We studied the problem of orbital diffusion in semi-major axis of minor bodies when more than one massive asteroid is considered. Our main results can be summarized as follows:
-
1.
We obtained the proper frequencies of precession of the argument of pericenter g and of longitude of the node s for (4) Vesta when other massive asteroids (up to 50) are considered along with the eight planets. The values fluctuated beyond a 3σ confidence level when 16 massive asteroids (S16 integration scheme) were considered, and lower fluctuations were also observed for different integrations schemes.
-
2.
We computed proper elements and maximum Lyapunov exponents for 6160 fictitious test particles in the Vesta family region when various number of massive asteroids were considered. The distribution of high MLEs obtained with the S1 integration scheme was not compatible with those obtained with the S23 and S51 schemes at the low confidence level of 10.0%, according to the results of a one-dimensional Kolmogorov-Smirnoff test, and lesser discrepancies were observed among other distributions such as those in S11, S23, and S51.
-
3.
We investigated the dynamical mobility caused by close encounters with massive asteroids for 1892 real asteroids in the region of (4) Vesta with absolute magnitude H < 13.5. We found that not only different asteroids experienced close encounters with (4) Vesta and other massive asteroids when different integration schemes were considered, but also that the whole statistics of close encounters with the four most massive bodies in the main belt fluctuated considerably when different integration schemes were used. Variances of the change in proper a caused by the four most massive asteroids varied up to 36.3% in the five integration schemes that we used, and the number of encounters that caused the strongest changes in semi-major axis varied by up to a factor 2.2.
-
4.
We studied the effect of close encounters with massive asteroids when the Yarkovsky and YORP effects were also considered and computed the value of the Hurst exponent T of the diffusion as a function of time, including the effect of the uncertainty caused by difference in the integration schemes as newly found in this work. We found that while the T values that best fitted our data are still compatible with scattering with massive asteroids being a persistent and correlated process (0.5 < H < 1.0), unfortunately, the uncertainties are so large that no final conclusions can be achieved. Previous values of Hurst exponents found in the literature should therefore be considered with some caution.
The main focus of this work was to study the indirect effect that the presence of other massive asteroids had on (4) Vesta and other main bodies in the main belt. The fact that (4) Vesta proper frequencies and the whole statistics of changes in semi-major axis caused by this asteroid changes when different integration schemes are adopted introduces a new uncertainty on the estimate of chaotic mobility caused by close encounters with massive asteroids obtained by our and other groups. Quantifying the amount of this uncertainty for massive bodies in the asteroid main belt other than (4) Vesta are challenges that remain for possible future works.
Online material
Appendix A: Asteroid astrometric masses
Asteroid astrometric masses, proper elements a and e, and Hill radii.
The elements of (433) Eros in Table A.1 are its osculating a and e at J2000. Proper elements for near Earth asteroids can be computed with the approach of Gronchi & Milani (2001; see also Vokrouhlický et al. 2005). Since in this work our goal was to obtain an order of magnitude estimate of the Hill sphere radius of massive asteroids, the use of osculating elements for (433) Eros seems justified, in our opinion.
The behavior of the proper frequencies of (4) Vesta may differ if longer time step are used in the simulation. This is because a smaller fraction of close encounters of massive asteroids with (4) Vesta is accounted for in this case. Qualitatively, however, the behavior is the same as seen in Fig. 3, panel A, with values of g near and far from the mean when different integration schemes are considered.
The 3ν6 − ν5 = 3(g − g6) − (g − g5) = 2g − 3g6 + g5 is classified as a g-type resonance in Machuca & Carruba (2011) because it involves a commensurability between the asteroidal g frequency and the planetary frequencies g5 and g6.
Acknowledgments
We thank J.-B. Delisle and J. Laskar for sharing their work with us and for discussions that inspired this research. We are most grateful to the referee of this paper, David Vokrouhlický, for comments and suggestions that significantly increased the quality of this paper, and to Fernando Roig, for reading an earlier version of this work, and for helpful hints and insights. This work was supported by the Brazilian National Research Council (CNPq), projects 302183/2008-6 and 473345/2009-9, and by the Foundation for Supporting Scientific Research in the São Paulo state (FAPESP), grant 11/19863-3.
References
- Baer, J., Chesley, S. R., & Matson, R. D. 2011, AJ, 141, 143 [NASA ADS] [CrossRef] [Google Scholar]
- Benettin, G., Galgani, L., Giorgilli, A., & Strelcyn, J. M. 1980, Mecanica, 15, 9 [NASA ADS] [CrossRef] [Google Scholar]
- Bowell, E., Hapke, B., Domingue, D., et al. 1989, Asteroids II, Univ. of Arizona, Tucson, 524 [Google Scholar]
- Carruba, V. 2010, MNRAS, 408, 580 [NASA ADS] [CrossRef] [EDP Sciences] [Google Scholar]
- Carruba, V., Burns, J. A., Bottke, W., & Nesvorný, D. 2003, Icarus, 162, 308 [NASA ADS] [CrossRef] [Google Scholar]
- Carruba, V., Nesvorný, D., Burns, J. A., Ćuk, M., & Tsiganis, K. 2004, AJ, 128, 1899 [NASA ADS] [CrossRef] [Google Scholar]
- Carruba, V., Roig, F., Michtchenko, T. A., Ferraz-Mello, S., & Nesvorný, D. 2007, A&A, 465, 315 [NASA ADS] [CrossRef] [EDP Sciences] [Google Scholar]
- Delbo, M., Dell’Oro, A., Harris, A. W., Mottola, S., & Mueller, M. 2007, Icarus, 190, 236 [NASA ADS] [CrossRef] [Google Scholar]
- Delisle, J.-B., & Laskar, J. 2012, A&A, 540, A118 [NASA ADS] [CrossRef] [EDP Sciences] [Google Scholar]
- Fienga, A., Laskar, J., Kuchynka, P., et al. 2011, Celest. Mech. Dyn. Astron., 101, 101 [Google Scholar]
- Gronchi, G. F., & Milani, A. 2001, Icarus, 152, 58 [NASA ADS] [CrossRef] [Google Scholar]
- Hamilton, D., & Burns, J. A. 1991, Icarus, 96, 43 [Google Scholar]
- Joanest, D. N., & Gill, C. A. 1998, The Statistician, 47, 183 [Google Scholar]
- Knežević, Z., & Milani, A. 2003, A&A, 403, 1165 [NASA ADS] [CrossRef] [EDP Sciences] [Google Scholar]
- Krasinsky, G. A., Pitjeva, E. V., Vasilyev, M. V., & Yagudina, E. I. 2002, Icarus, 158, 98 [CrossRef] [Google Scholar]
- Laskar, J., Gastineau, M., Delisle, J.-B., Farrés, A., & Fienga, A. 2011, A&A, 532, L4 [NASA ADS] [CrossRef] [EDP Sciences] [Google Scholar]
- Levison, H. F., & Duncan, M. J. 2000, AJ, 120, 2117 [NASA ADS] [CrossRef] [Google Scholar]
- Lyapunov, A. M. 1907, Annales Fac. Sci. Univ. Toulouse, 74, 59 [Google Scholar]
- Machuca, J. F., & Carruba, V. 2011, MNRAS, 420, 1779 [Google Scholar]
- Masiero, J. R., Mainzer, A. K., Grav, T., et al. 2011, ApJ, 741, 68 [NASA ADS] [CrossRef] [Google Scholar]
- Mikkola, S., & Innanen, K. A. 1999, Celest. Mech. Dyn. Astron., 74, 59 [NASA ADS] [CrossRef] [Google Scholar]
- Press, V. H., Teukolsky, S. A., Vetterlink, W. T., & Flannery, B. P. 2001, Numerical Recipes in Fortran 77 (Cambridge: Cambridge Univ. Press) [Google Scholar]
- Šidlichovský, M., & Nesvorný, D. 1997, Celest. Mech. Dyn. Astron., 65, 137 [Google Scholar]
- Vokrouhlický, D. 1999, AJ, 116, 2032 [NASA ADS] [CrossRef] [Google Scholar]
- Vokrouhlický, D., Bottke, W. F., & Nesvorný, D. 2005, Icarus, 175, 419 [NASA ADS] [CrossRef] [Google Scholar]
- Wisdom, J., & Holman, M. 1991, AJ, 102, 1528 [NASA ADS] [CrossRef] [Google Scholar]
All Tables
Numbers of encounters, moments, and Hurst exponents of the da distribution caused by close encounters with massive asteroids.
All Figures
|
Fig. 1 Fraction of the main belt mass as a function of the number of massive asteroids in the order given in Table A.1. |
| In the text | |
|
Fig. 2 Fourier spectra of pericenter precession frequencies g for (4) Vesta in the S1 simulation (black line), in the S11 (blue dotted line), and in the S51 (red dotted line). On the y-axis we reported the amplitude of the frequency normalized with respect to the g-frequency of (4) Vesta. |
| In the text | |
|
Fig. 3 Panel A) dependence of the precession frequency of the Vesta pericenter g on the number N of other massive asteroids included in the simulation. Asteroids are given in the order of Table A.1. Panel B) the number of close encounters with massive asteroids of (4) Vesta as a function of N. |
| In the text | |
|
Fig. 4 Synthetic proper element map in the (a, sin(i)) plane of the region near (4) Vesta (black dots). Vertical red lines show the location of the main mean-motion resonances. The magenta full dot shows the orbital location of (4) Vesta, the cyan circle shows asteroids to within an arcsec from the center of the z3 secular resonance, yellow circles are associated with test particles near the z2 secular resonance, red circles are associated to the 2ν6 + ν5 − ν16 resonance, and blue circles display the orbital location of the 3ν6 − ν5g-type resonance. |
| In the text | |
|
Fig. 5 Panel A) values of Lyapunov times for particles in the proper (a, sin(i)) plane in the region of (4) Vesta, integrated in the S1 scheme; blue circles are associated with TL < 2000 yr, while yellow circles are related to orbits with 2000 < TL < 10 000. The other symbols are the same as in Fig. 4. Panels B)–D) the same projection, but for particles integrated in the S11, S23, and S51 schemes, respectively. |
| In the text | |
|
Fig. 6 Histogram of particles with short Lyapunov times in the S1, S11, S23, and S51 integration scheme. |
| In the text | |
|
Fig. 7 An (a, sin(i)) projection of H < 13.5 asteroids subject to the gravitational influence of all planets plus (4) Vesta (panel S1). Small full blue dots show the location of objects that experienced | da | < 6 × 10⁻⁴ AU or | da | < 3σnoise, and the large red full dots are related to asteroids whose | da | was larger than the 3σnoise. Panels S4, S8, and S11 show the same asteroids, but integrated in the S4, S8, and S11 integration schemes. |
| In the text | |
|
Fig. 8 Histograms of changes in proper a caused by (4) Vesta in the S1, S4, S8, S11, and S12 integration schemes. |
| In the text | |
Current usage metrics show cumulative count of Article Views (full-text article views including HTML views, PDF and ePub downloads, according to the available data) and Abstracts Views on Vision4Press platform.
Data correspond to usage on the plateform after 2015. The current usage metrics is available 48-96 hours after online publication and is updated daily on week days.
Initial download of the metrics may take a while.