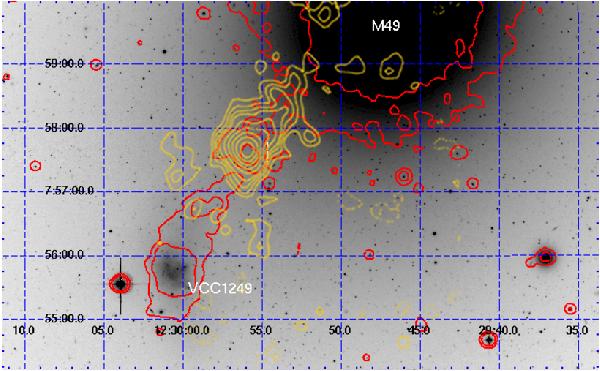
Fig. 6

NGVS g image of VCC 1249 (bottom-left) and of M 49 (top-center) on which the NUV contours (red) and the H i contours taken from McNamara et al. (1994) (yellow) are superposed (the coordinates are precessed from B1950 originally used, to J2000). Note that the peak of the H i cloud nearly coincides with the peak of the NUV emission at the position of the region C2 (LR1 in Lee et al. 2000).
Current usage metrics show cumulative count of Article Views (full-text article views including HTML views, PDF and ePub downloads, according to the available data) and Abstracts Views on Vision4Press platform.
Data correspond to usage on the plateform after 2015. The current usage metrics is available 48-96 hours after online publication and is updated daily on week days.
Initial download of the metrics may take a while.


