Free Access
Fig. 5
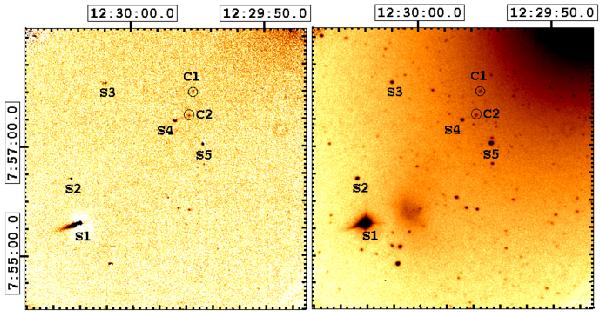
Hα image of VCC 1249 and the outlying H ii regions obtained at the SPM telescope. Left: Hα net emission line. Right: Hα plus stellar continuum frame H ii regions C1 and C2 are labeled. Stars with apparent residual NET emission (see text) are labeled S1 to S5. Note the lack of substantial emission from VCC 1249.
Current usage metrics show cumulative count of Article Views (full-text article views including HTML views, PDF and ePub downloads, according to the available data) and Abstracts Views on Vision4Press platform.
Data correspond to usage on the plateform after 2015. The current usage metrics is available 48-96 hours after online publication and is updated daily on week days.
Initial download of the metrics may take a while.