Fig. 2
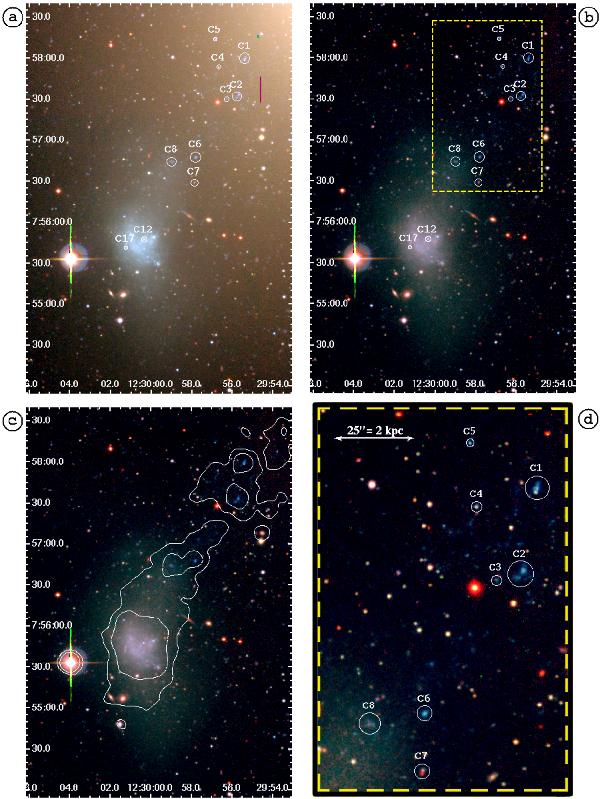
a) RGB image of VCC 1249 obtained combining the NGVS images in the u,g,z filters. The outlying H ii regions studied in this work are highlighted. Contamination from the light associated with the halo of M 49 is clearly visible. b) RGB image of VCC 1249 obtained after subtracting a model for the light distribution in M 49. c) NUV contours superposed on the RGB image of VCC 1249, after subtracting M 49. d) Enlargement of the region enclosed in the dashed yellow box in panel b). Faint blue structures are visible near the highlighted H ii regions.
Current usage metrics show cumulative count of Article Views (full-text article views including HTML views, PDF and ePub downloads, according to the available data) and Abstracts Views on Vision4Press platform.
Data correspond to usage on the plateform after 2015. The current usage metrics is available 48-96 hours after online publication and is updated daily on week days.
Initial download of the metrics may take a while.