Fig. 14
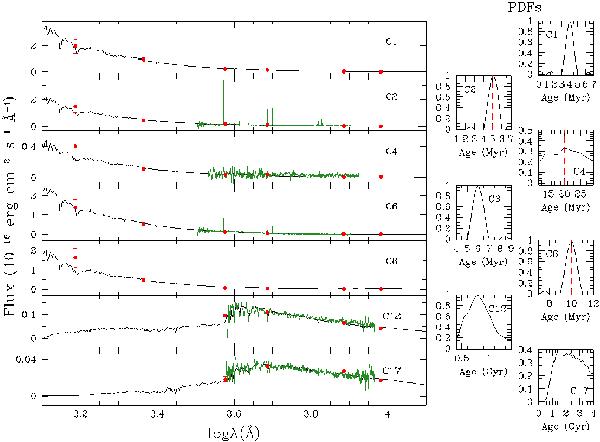
Summary plot of the photometric points for the H ii regions (red), observed optical spectrum if available (green) and their best-fit SEDs. Data for C1, C2, C4, C6, and C8 have been modeled using a single burst, while C12 and C17 using an exponentially declining SFR. The probability distribution functions for the age parameter of each individual region are shown in the right panels.
Current usage metrics show cumulative count of Article Views (full-text article views including HTML views, PDF and ePub downloads, according to the available data) and Abstracts Views on Vision4Press platform.
Data correspond to usage on the plateform after 2015. The current usage metrics is available 48-96 hours after online publication and is updated daily on week days.
Initial download of the metrics may take a while.