Fig. 5
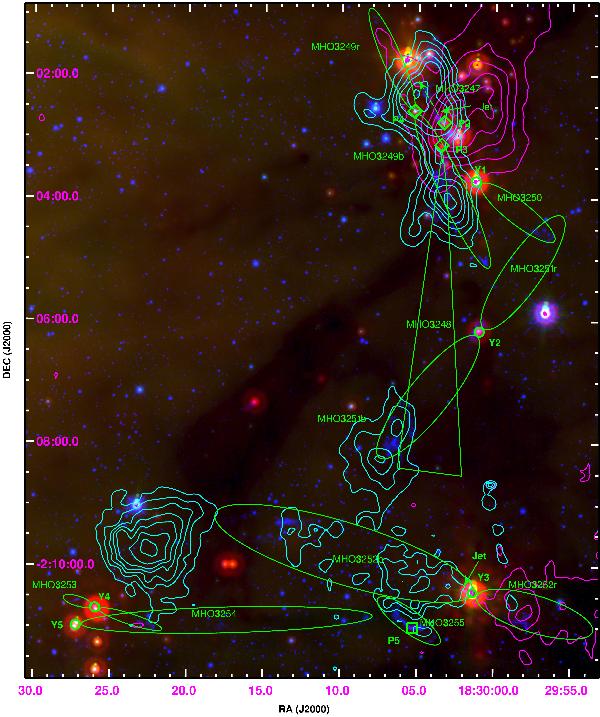
A color image of the southern region studied, where the Spitzer MIPS 24 μm data is indicated in red, Spitzer MIPS 4.5 μm in green, and H2 narrowband image in blue. The images use a logarithmic scale. The red- and blue-shifted CO emission mapped by Nakamura et al. (2011) is displayed using, respectively, pink and blue contours.
Current usage metrics show cumulative count of Article Views (full-text article views including HTML views, PDF and ePub downloads, according to the available data) and Abstracts Views on Vision4Press platform.
Data correspond to usage on the plateform after 2015. The current usage metrics is available 48-96 hours after online publication and is updated daily on week days.
Initial download of the metrics may take a while.