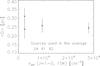
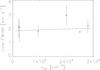
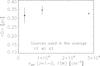
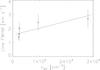
Fig. 10
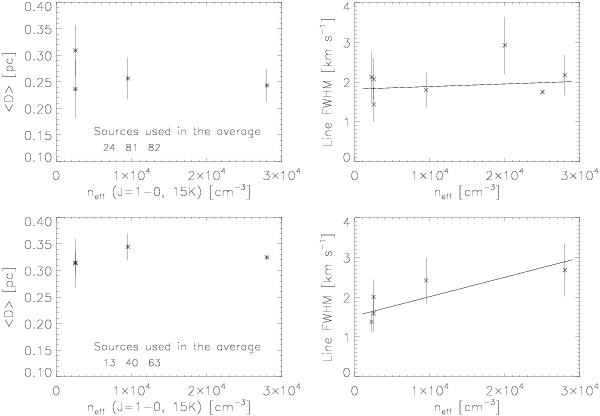
Median core size (left panels) and median linewidth, ΔV (right panels) vs. neff (at 15 K), shown separately for a sub-sample of proto-stellar (top row) and starless (bottom row) cores. The plot of ΔV vs. neff makes use of the single-point observations, instead of spectral line maps as in the left panels, allowing for more molecular lines to be used. The effective densities are listed in Table 2. The plot also includes some detections of the HC3N(1 − 0) line, with neff = 2.5 × 10⁴. The solid line represents the linear fit (from Bayesian statistics) to all points.
Current usage metrics show cumulative count of Article Views (full-text article views including HTML views, PDF and ePub downloads, according to the available data) and Abstracts Views on Vision4Press platform.
Data correspond to usage on the plateform after 2015. The current usage metrics is available 48-96 hours after online publication and is updated daily on week days.
Initial download of the metrics may take a while.