Fig. 8
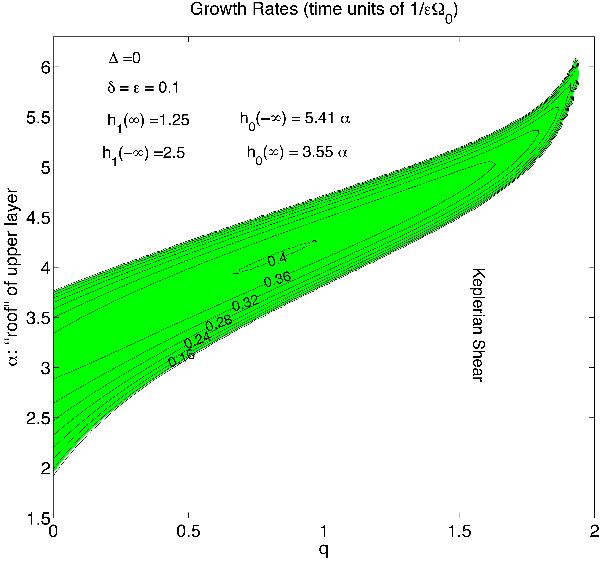
Model admitting baroclinic instability in which the jets in each layer lie exactly on top of each other (Δ = 0). The plot depicts the variation of the growth rates as a function of the shear q and the so-called “lid” of the atmosphere α (see text). For this atmosphere model the radial boundaries are set to L = 10. Keeping all parameters fixed but rerunning this atmosphere model with L = 15 reveals that all instabilities depicted in this figure vanish.
Current usage metrics show cumulative count of Article Views (full-text article views including HTML views, PDF and ePub downloads, according to the available data) and Abstracts Views on Vision4Press platform.
Data correspond to usage on the plateform after 2015. The current usage metrics is available 48-96 hours after online publication and is updated daily on week days.
Initial download of the metrics may take a while.