Free Access
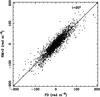
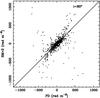
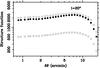
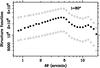
Fig. 7
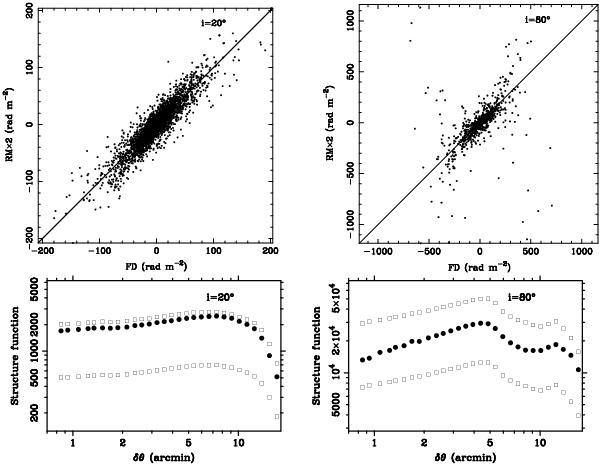
RMs times a factor of two versus FDs (top row). The solid line indicates the expectation for uniformly mixed thermal and synchrotron emission. The structure functions (bottom row) from the FD maps are shown by black dots, those from RM maps and RMs scaled by a factor of two by squares.
This figure is made of several images, please see below:
Current usage metrics show cumulative count of Article Views (full-text article views including HTML views, PDF and ePub downloads, according to the available data) and Abstracts Views on Vision4Press platform.
Data correspond to usage on the plateform after 2015. The current usage metrics is available 48-96 hours after online publication and is updated daily on week days.
Initial download of the metrics may take a while.