Fig. 3
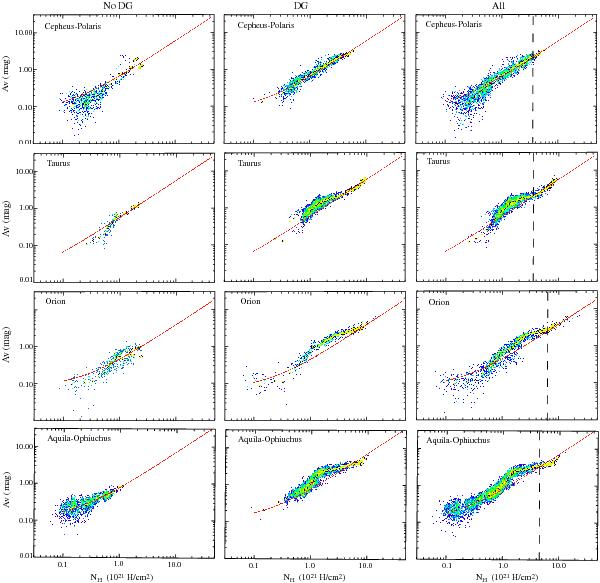
Correlation plots between extinction data (AV) and the total gas column density ( ) in various regions excluding the Galactic plane ( | b | > 10°), from top to bottom the Cepheus-Polaris, Taurus, Orion, and Aquila-Ophiuchus regions. Left, middle, and right panels correspond respectively, to regions where no DG is detected (“no DG”) according to Planck Collaboration (2011a), where strong DG is detected (“DG”), and the entire region (“All”) (see Sect. 3.1). The color scale represents the density of pixels on a log scale. The description of the yellow dots, red, and dashed lines is given in the caption of Fig. 2.
Current usage metrics show cumulative count of Article Views (full-text article views including HTML views, PDF and ePub downloads, according to the available data) and Abstracts Views on Vision4Press platform.
Data correspond to usage on the plateform after 2015. The current usage metrics is available 48-96 hours after online publication and is updated daily on week days.
Initial download of the metrics may take a while.