Fig. 2
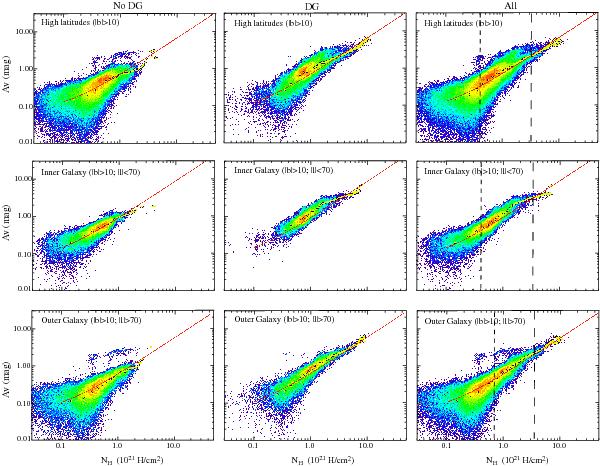
Correlation plots between extinction data (AV) and the total gas-column density ( ) excluding the Galactic plane ( | b | > 10°): high latitude sky (top panels), inner Galaxy (middle panels) and outer Galaxy (bottom panels). Left, middle, and right panels correspond respectively, to regions where no DG is detected (“no DG”) according to Planck Collaboration (2011a), where strong DG is detected (“DG”), and the entire region (“All”) (see Sect. 3.1). The color scale represents the density of pixels on a log scale. The yellow dots show the correlation binned in NH. The red lines show the best-fit linear correlation, constrained for the whole data in the “no DG” region. The short-dashed and long-dashed lines indicate the position of a departure from a linear fit, and the position where the correlation recovers a linear behavior, respectively.
Current usage metrics show cumulative count of Article Views (full-text article views including HTML views, PDF and ePub downloads, according to the available data) and Abstracts Views on Vision4Press platform.
Data correspond to usage on the plateform after 2015. The current usage metrics is available 48-96 hours after online publication and is updated daily on week days.
Initial download of the metrics may take a while.