Fig. 1
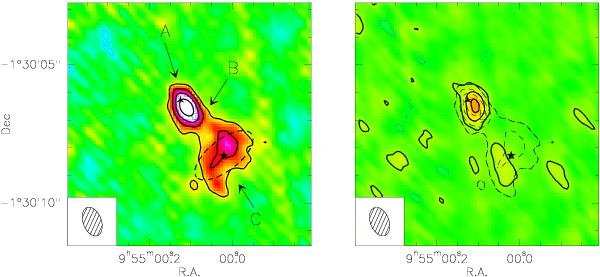
Map of BRI 0952-0115 obtained with the PdBI. The synthesized beam of 1.08′′ × 0.66′′ is shown in the bottom-left insets. Left panel: map of the [CII] line emission region integrated over a velocity range of 300 km s-1, i.e. −210 < v < 90 [km s-1] . Contour levels are shown in steps of 2.5σ, where 1σ = 0.5 Jy km s-1 beam-1. The filled three-points star, empty square, and filled five-points star represent the positions of the components A, B and C, respectively (Table 2). The dashed ellipse denotes the result of the fit to the extended component C. Right panel: map of the continuum emission obtained from the line-free channels of the 3.6 GHz wide spectrum (i.e. v < −210 km s-1 and v > 90 km s-1). Contour levels are shown in steps of 2.5σ, where 1σ = 0.5 mJy beam-1. Dashed lines show the positive contours of the [CII] emission as in the left panel. In both panels, negative contour levels at 2.5σ are shown with dotted lines.
Current usage metrics show cumulative count of Article Views (full-text article views including HTML views, PDF and ePub downloads, according to the available data) and Abstracts Views on Vision4Press platform.
Data correspond to usage on the plateform after 2015. The current usage metrics is available 48-96 hours after online publication and is updated daily on week days.
Initial download of the metrics may take a while.