| Issue |
A&A
Volume 543, July 2012
|
|
|---|---|---|
| Article Number | A20 | |
| Number of page(s) | 13 | |
| Section | Stellar structure and evolution | |
| DOI | https://doi.org/10.1051/0004-6361/201118577 | |
| Published online | 21 June 2012 | |
A complete X-ray spectral coverage of the 2010 May–June outbursts of Circinus X-1⋆
1 Dipartimento di Fisica, Università di Palermo, via Archirafi 36, 90123 Palermo, Italy
e-mail: This email address is being protected from spambots. You need JavaScript enabled to view it.
2 ISDC Science Data Center for Astrophysics of the University of Geneva, chemin d’Ecogia, 16, 1290 Versoix, Switzerland
3 Dipartimento di Fisica, Università degli Studi di Cagliari, SP Monserrato-Sestu, KM 0.7, 09042 Monserrato, Italy
4 Institut de Ciències de l’Espai (IEEC-CSIC), Facultat de Ciències, Campus UAB, Torre C5, Pares, 2da Planta, 08193- Bellaterra, Spain
5 INAF Osservatorio Astronomico di Cagliari, Poggio dei Pini, Strada 54, 09012 Capoterra, Italy
Received: 4 December 2011
Accepted: 7 April 2012
Abstract
Context. Circinus X-1 is a neutron-star-accreting X-ray binary in a wide (Porb = 16.6 d), eccentric orbit. After two years of relatively low X-ray luminosity, in May 2010 Circinus X-1 went into outburst, reaching 0.4 Crab flux. This outburst lasted for about two orbital cycles and was followed by another shorter and fainter outburst in June.
Aims. We focus here on the broadband X-ray spectral evolution of the source as it spans about three order of magnitudes in flux. We attempt to relate luminosity, spectral shape, local absorption, and orbital phase.
Methods. We use multiple Rossi-XTE/PCA (3.0−25 keV) and Swift/XRT (1.0−9.0 keV) observations and a 20 ks long Chandra/HETGS observation (1.0−9.0 keV), to comprehensively track the spectral evolution of the source during all the outbursting phases. These observations were taken every two/three days and cover about four orbital cycles. The PCA data mostly cover the major outburst, the XRT data monitor the declining phase of the major outburst and all the phases of the minor outburst, and Chandra data provide an essential snapshot of the end of this overall outbursting phase.
Results. The X-ray spectrum can be satisfactorily described by a thermal Comptonization model with variable neutral local absorption in all phases of the outburst. No other additive component is statistically required. The first outburst decays linearly, with an ankle in the light curve as the flux decreases below ~5 × 10⁻¹⁰ erg cm-2 s-1. At the same time, the source shows a clear spectral state transition from an optically thick to an optically thin state. While the characteristics of the first, bright, outburst can be interpreted within the disk-instability scenario, the following, minor, outburst shows peculiarities that cannot be easily reconciled in this framework.
Key words: X-rays: binaries / X-rays: individuals: Circinus X-1 / accretion, accretion disks / line: profiles
Tables 1–3 are available in electronic form at http://www.aanda.org
© ESO, 2012
1. Introduction
Circinus X-1 (Cir X-1) is one of the most peculiar, though most well-studied accreting X-ray binary (XRB) of the Galaxy. Almost daily monitoring of this source, with the Rossi-XTE (RXTE) All Sky Monitor (ASM), starting from the beginning of 1996 has provided an uninterrupted insight into the X-ray history of this source in the past 15 years; from 1996 up to 2000, it was one of the brightest sources of the X-ray sky (at ~3 Crab level), but from 2000 to 2006 its luminosity steadily decreased, reaching in 2007 a new state characterised by a persistent mCrab flux level, with sporadic several-week-long outbursts. Chandra observations during a faint X-ray state have revealed a complex, parsec-scale, X-ray emitting structure, consisting of spatially resolved X-ray arcsec-long jets, embedded in an inflated arcmin radio lobe structure, possibly powered by the jet activity (Stewart et al. 1993; Tudose et al. 2006; Heinz et al. 2007; Soleri et al. 2009). Miller-Jones et al. (2012) resolved the jet emission up to the milliarcsecond-scale, distinguishing the symmetry of the jet structure, which has an extent of the order of ~150 AU, and a variability consistent with a mildly relativistic jet-speed.
The nature of the compact object, neutron star (NS), or black-hole (BH) has long been debated, because Cir X-1 shared spectral timing properties amid the BH and NS class. The resumption in May 2010 of bursting activity (Papitto et al. 2010; Linares et al. 2010), definitively confirmed the initial discovery of type-I X-ray bursts in 1986 (Tennant et al. 1986), and its association with the NS class.
A periodicity of ~16.6 days observed in different wavebands, from radio to X-rays, is associated with the orbital period of the system. The characteristic timescale for the orbital evolution (P/2Ṗ) is very short, ~1400 yr, suggesting that Cir X-1 may be a very young system (Parkinson et al. 2003). The NS magnetic field might be in-between those of typical old low-mass XRB (B ~ 108 − 109 G) and high-mass systems (B ~ 1011 − 1012 G), thus permitting the occurrence of X-ray bursts at lower accretion rates.
The X-ray emission from Cir X-1 is also very peculiar. It has been found that Cir X-1 shows strong variability caused by its rapidly varying mass accretion rate and the global physical conditions of the local environment. At high luminosity (probably near the Eddington limit), the X-ray broadband (0.1 − 200 keV) spectrum could be satisfactorily described in terms of Comptonized emission, where soft photons of 0.4 − 0.5 keV are upscattered in a cloud of moderate optical depth (14 < τ < 20) and 0.8 − 1.7 keV electron temperature (Iaria et al. 2001a,b, 2002). The inferred radius of the Comptonizing plasma (90 km < Rw < 160 km), was found to be much greater than the classical NS dimensions, suggesting that we observe a truncated accretion disk. Other components have occasionally been detected, in both the hard X-ray domain (above 15 keV, Iaria et al. 2001a) and at very soft energies (below 1 keV, Iaria et al. 2002). The former was interpreted as a possible signature of non-thermal Comptonization, whereas the latter was more elusive to constrain spectrally, owing to the possible presence of a warm ionised absorber that would produce multiple absorption edges in this range (Iaria et al. 2005). In addition to this, often near the periastron passage, a variable cold absorber, with column density values up to 1024 cm-2, can partially occult the primary emission, causing multiple dips in the light curve (Brandt et al. 1996; Shirey et al. 1999).
High-resolution Chandra observations revealed P-Cygni profiles of highly ionised elements, which are indicative of a radiatively supported accretion-disk wind (Brandt & Schulz 2000; Schulz & Brandt 2002) seen at high inclination angle. Subsequent Chandra observations, performed when the source accreted at substantially lower accretion rates, revealed a complex pattern of absorption features of highly ionised elements, the latter of which emerged as the source entered a several-hour-long period of flaring activity (D’Aí et al. 2007). The discovery of a highly ionised absorber, strongly dependent on the accretion rate of the source, favoured again a close to edge-on geometry, where optically thick disk material is radiatively uplifted from the disk surface. However, the measured jet inclination angle (~5°Fender & Hendry 2000) and absence of a clear regularity in dips, which is typical of dipping X-ray systems, place in doubt the suitability of this scenario.
The companion star has not yet been clearly resolved. Jonker et al. (2007) suggested that there is a possible giant optical counterpart, based on phase-resolved I-band optical spectroscopic and photometric observations. These spectra display evidence of broad absorption Paschen lines (but in emission during the phase-zero passage), which is consistent with a B5-A0 spectral type. A 1.4 M⊙ NS would constrain the inclination angle and the companion mass to be ≳13 7 and ≲ 10 M⊙, respectively.
The source distance is poorly constrained. Early suggestions based on radio HI absorption features suggested a lower limit of 8 kpc (Goss & Mebold 1977), while an estimate based on the energetics of X-ray bursts indicated a range between 7.8 kpc and 10 kpc (Jonker & Nelemans 2004). Distance based on the equivalent X-ray hydrogen column estimate and a re-analysis of the HI velocity drifts of the companion start (Mignani et al. 2002) led to a different estimate of 4.1 ± 0.3 kpc (Iaria et al. 2005). To be consistent with the most recent literature’s reported luminosities, we assume, hereafter, a distance of 7.8 kpc. Luminosities for a distance of 4.1 kpc should then be scaled by a factor of ~ 0.3.
2. Observations, light curves, and data reduction
Starting from June 2008, the source entered a prolonged state of X-ray faintness at the few mCrab level, which was interrupted by a bright outburst, peaking at 0.4 Crab flux, on 2010 May 9. The outburst started at ~0.1 phase after the TJD 15322.04 phase-zero passage according to the ephemeris of Nicolson (2007)1, with a rising time shorter than two days. As the luminosity decreased, after two orbital cycles, another outburst, peaking at ~0.1 Crab, was detected on 2010 June 12. We present in the upper panel of Fig. 1, the RXTE ASM light curve of Cir X-1 during the whole April − July 2010 period, with superimposed the visits of the RXTE, Swift, and Chandra follow-ups. Dotted-lines indicate the phase zero passages according to the ephemeris of Nicolson (2007).
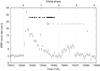 |
Fig. 1 Daily-averaged ASM light curve (2 − 12 keV range) of Cir X-1 between 2010 April 19 and 2010 July 13. Markers for the RXTE (filled circles), Swift (open circles), and Chandra (diamond) observations are superimposed. Phase zero orbital passages are marked by grid lines. |
2.1. The RXTE monitoring campaign
We studied RXTE observations of Cir X-1 from 2010 May 11 to June 3. We extracted and reduced data only from the Proportional Counter Unit (PCU) 2, since this counter had the highest PCU exposure time, applying standard filtering criteria. We created additional good time intervals to exclude all type-I X-ray bursts eventually present in the data. The burst properties were studied in Linares et al. (2010). We used the 3.0−25.0 keV energy range (3.0−20 keV, when the signal-to-noise ratio was too poor above 20 keV) and a systematic error of 1% was added in quadrature to the best-fit model. We also cross-checked our spectral results using only the top-layer spectra, finding self-consistent results. We applied the bright background model to extract the background spectra and light curves. We verified that when the source becomes faint at the end of the outburst, the choice between bright and faint background models does not alter the conclusions of our analysis. A log of all the observations (hereafter, we refer to the single pointed RXTE observation using the last four digits of its observation identifier, or ObsId) used in the analysis is presented in Table 1.
We present in Fig. 2 the 2−60 keV RXTE light curve. Each point represents the average, background-subtracted, count rate during a pointed RXTE observation. The light curve is well-described by a combination of two linear decays; the first linear covers the first 20.5 days from the start of the RXTE monitoring, whereas a change in the slope of the linear fit covers the last five days of the RXTE monitoring (alternatively, an exponential fit with a 1.35 d decay-time also gives a good fit to this last set of data). We present in the lower panel the residuals in units of σ with respect to this phenomenological model of two linear decays, where the two lines join at day 20.433 (TJD 15 347.4591) and we also discern the mid-time between the two observations where a clear change in the spectral shape (see Sect. 2.1). Since the slope decay flattens after the transition, we refer to this feature as an ankle.
To characterise the spectral evolution of the source during the RXTE campaign in a model-independent way, we produced two different hardness ratios (HR), for the energy bands: 3−6 keV, 6−9 keV, and 9−30 keV. In the upper panel of Fig. 3, we show the HR of (6−9) keV/(3−6) keV count rates (soft HR), and, in the lower panel, the HR of (9−30) keV/(6−9) keV count rates (hard HR). The panels show different trends as the outburst evolves. We distinguish five different regions: the region A covers the first RXTE observation at the highest count rate/luminosity; region B covers about ten days as the spectrum progressively becomes harder, both in the soft and in the hard ratios; region C is characterised by variable local absorption at the periastron passage; region D and E show a softening, in the soft ratio; and region E shows a clear hardening only in the hard ratio. We give a model-dependent description of these trends in Sect. 3.
 |
Fig. 2 Best-fit model for the RXTE light curve (upper panel) and residuals in units of standard deviations (lower panel). Each point represents the average net (2 − 60 keV) light-curve count-rate in one ObsId. Time 0 corresponds to TJD 15 327.0261. |
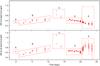 |
Fig. 3 Hardness ratios of the May 2010 Cir X-1 outburst. Each point represents the ratio of the average count rates in a 256 s time interval for the energy bands reported in y-labels. |
2.2. The Swift monitoring campaign
Swift monitored Cir X-1 for two orbital cycles, from 2010 May 27 19:47:15 UT to 2010 June 30 21:32:57 UT. Swift regularly visited the source every two/five days. According to the Swift/XRT count rate, the XRT data-collecting mode switched from the photon-counting mode (PC mode), for low count rates, to the window-timing mode (WT mode), for high count rates. We present the log of all these observations in Table 2. Hereafter, we refer to each single observation, using only the last two digits of its ObsId. We focus, in the present work, on the data analysis and interpretation of the X-ray spectrum using data from the Swift/XRT instrument, filtering out time intervals around the type-I X-ray bursts (present in ObsId 32, 33 and 34; see Linares et al. 2010).
Data were extracted according to standard selection and reduction criteria (Burrows et al. 2005) and the latest available calibration files (CalDB v. 20100528). The Swift/XRT data were analysed in both WT and PC modes (processed with the xrtpipeline v. 0.12.3). Filtering and screening criteria were applied by using the ftools software package (HEASoft v. 6.11). We extracted source and background light curves and spectra by selecting event grades of 0−2 and 0−12 for the WT and PC modes, respectively. Exposure maps were created through the xrtexpomap task, and we used the latest spectral redistribution matrices in the HEASARC calibration database. Ancillary response files, accounting for different extraction regions, vignetting, and PSF corrections were generated using the xrtmkarf task. When required, we corrected PC observations for pile-up following standard procedures. The Swift/XRT light curves were corrected for PSF losses and vignetting using the xrtlccorr task.
To perform the Swift/XRT spectral analysis, we used the 1.5−9.0 keV energy range for spectra in the WT mode, as this range provides the highest quality statistics and calibration accuracy. We note that data below 1.5 keV in this mode are affected by a spurious soft excess, that has been previously reported in case of bright, highly absorbed sources2. For spectra taken in PC mode, we exploited a broader energy range (0.8−9.0 keV), as no calibration issue affects the softer band in this mode. We rebinned the spectra to have at least 50 counts per energy channel for spectra with high quality statistics; for PC spectra with a small number of total counts, channels were rebinned less coarsely with a sampling of 25 counts per channel, to apply the χ2 statistics, still preserving a sufficient number of channels to allow a reliable estimate of the spectral shape.
As shown in Fig. 1, the Swift observations partially overlap with the RXTE observations during the declining part of the May outburst. A close-up of the Swift/XRT observations with labels indicating the time positions of the different ObsId, is shown in Fig. 4. The Swift/XRT data have complementary advantages with respect to the PCA data, as a higher energy resolution and a softer energy band. However, its effective area decreases sharply above 7 keV so that the continuum emission, determined by means of spectral model fitting, can be difficult to constrain. To compensate for this, we model the spectra, when a quite close (within one day) RXTE observation is at hand, using both the Swift/XRT and the RXTE/PCA data. The PCA data are used in the 7.0−20.0 keV range, to provide a reliable high-energy determination of the spectrum. We take into consideration a relative normalisation constant between the Swift/XRT and RXTE/PCA spectra to take into account possible flux differences and calibration issues.
ObsId 31, 32, and 33 were performed before the slope change observed in the light curve of the RXTE data; ObsId 34, 38, and 40 track the rapidly decaying stage of the May outburst to a very faint luminosity state. Starting from ObsId 41, a new outburst was detected. The new outbursting phase lasted for about half orbital cycle and turned off starting from the phase-zero passage at TJD 15 371.6. The final three observations cover the return to the pre-outburst, faint state.
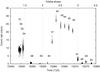 |
Fig. 4 Light curve (time bin of 200 s) of the Swift/XRT observations of Cir X-1, with indications of the ObsIds of Table 2. |
2.3. The Chandra observation
The Chandra observation started on 2010 July 4 05:05:10 TT (TJD 15 381.212) and ended on 2010 July 4 11:10:20 TT (TJD 15 381.466), which correspond to the phase interval 3.5823−3.5977. The net exposure of the observation amounts to 20 020 s. Chandra observed Cir X-1 with the High Energy Transmission Grating Spectrometer (HETGS) in FAINT mode; we used Sim-Z = −8 mm and a sub-array (ROWS = 1−350). The ACIS-S0 and ACIS-S5 were turned off in order to mitigate the possible presence of pile-up, given a large uncertainty in the flux prediction. The count rate in the HETGS was however lower than foreseen and pile-up did not affect the first-order grating spectra. The HETGS consists of two types of transmission gratings, the Medium Energy Grating (MEG) and the High Energy Grating (HEG). The HETGS provides high-resolution spectroscopy from 1.2 Å to 31 Å (0.4−10 keV); the peak spectral resolution is of λ/Δλ ~ 1000 at 12 Å for the HEG first order. The frame time for this observation, corresponding to the time resolution at which events are collected, is 1.24104 s.
The light curve of the Chandra observation is shown in Fig. 5. During the observation, a type-I X-ray burst is clearly detected 12 930 s after the start of the observation (see Fig. 5, left panel). The burst shows a typical fast-rise exponential-decay (FRED) shape, with a rise time <2 s, and an exponential decay time of 10.2 s. The total energy released by the burst is ~2 × 1038 erg.
 |
Fig. 5 Chandra light-curve (sum of first order HEG and MEG counts) of the Cir X-1 observation. Time zero corresponds to TJD 15 381.21190. Bin time is 20 s. Insert panel: snapshot of the type-I X-ray burst, bin time is 2 s. |
In our spectral analysis, we used the Chandra HEG and MEG first-order spectra. We examined only the persistent emission and excluded the time interval around the burst event (10 s before the peak and 100 s after the peak). We processed the event list using available software (CIAO ver. 4.1.2) and computed aspect-corrected exposure maps for each spectrum in order to take into account their effects on the effective area of the CCD spectrometer. Spectra were rebinned to ensure that we had at least 25 counts per channel energy. We used HEG (and MEG) data in the 1.5 − 9.0 keV (1.4 − 5.0 keV) range, ans a normalisation multiplicative constant between the MEG and HEG data to take into account the relative flux and calibration uncertainties, whose value was 0.94 ± 0.4 for the HEG with respect to the MEG data-set (frozen to unity) for the model in Table 3.
3. Spectral analysis
3.1. Model
In our spectral analysis, we used Xspec version 12.5.0 (Arnaud 1996). The fluxes and associated errors were calculated using the convolution model cflux available in Xspec. Since cflux calculates the flux only within the band covered by the response matrix of the instrument, we used a dummy response matrix to calculate the extrapolated luminosities. Errors are reported at the 90% confidence level for a single parameter of interest.
We modelled the spectra, in all the outburst phases, using a thermal Comptonized component (comptt, Titarchuk 1994). The effect of interstellar absorption (NH) was modelled with the phabs component. Although different two-component models (e.g. two black-bodies, or a black-body and a cut-off power-law) could also provide acceptable χ2 values, this choice offered several more solid advantages: it is a model that closely matches the results of previous spectral decomposition attempts for the available fitted X-ray range; it avoids non-physically high extrapolated fluxes outside the range covered by the data; it allows us to follow the most significant spectral changes keeping the number of free parameters to a minimum; and it provides statistically acceptable fits. The Comptonization is determined by the temperature of the soft photons (kT0), the electronic temperature (kTe), the optical depth (τ) of the cloud, which is assumed to be spherical, and a normalisation parameter related to the flux. No other additional broadband continuum component is statistically required for any of the examined spectra.
In many of the RXTE/PCA spectra, the interstellar absorption was poorly constrained, when NH < 2 × 1022 cm-2. In these cases, we set this parameter to 1 × 1022 cm-2 (this choice will be motivated a posteriori, see Sect. 4.1), to better constrain the other fit parameters. We added a neutral partial covering component (pcfabs in Xspec), if the probability of chance improvement was less than 5%. When the pcfabs component was used, the phabs NH value was frozen to the reference value of 1 × 1022 cm-2 to avoid strong correlations among the spectral parameters. This component was required mostly for spectra close to the periastron. The RXTE observation ObsId 03-01 displays this strong variability, and we dedicate the next subsection to this particular data-set. In addition, an iron Kα Gaussian line, in the 6.4 − 7.0 keV range, was added to the best-fit model if its significance was more than 4σ. We show in Table 3 the spectral fitting results. Parameters with no associated error were kept frozen during the fitting. The unabsorbed fluxes were calculated in the 2.0 − 20 keV band in units of 10-10 erg cm-2 s-1, and are plotted as a function of the orbital phase in Fig. 6.
 |
Fig. 6 2 − 20 keV unabsorbed flux (in units of 10-10 erg cm-2 s-1) as a function of the orbital phase. |
3.2. Results
Almost the entire May outburst is well-covered by RXTE pointings, with a total exposure of ~74 ks in 23.7 days. We collected a total of 27 PCU2 spectra. In 13 spectra, a Gaussian Fe Kα line, with rest-frame energies of between 6.4 keV and 6.6 keV was required to obtain acceptable χ2 values. The equivalent width of this line varied between 20 and 80 eV, during the initial phase of the outburst and showed a significant increase as the spectrum became harder. The first spectrum (ObsId 01-00) is the most luminous of the series (8.4 × 10⁻⁹ erg cm-2 s-1), showing evidence of local neutral absorption at orbital phase 0.302. The spectrum is satisfactorily described by an optically thick Comptonized component (τ ~ 12), where soft photons of ~0.84 keV are upscattered by thermal electron of energy ~2.74 keV. No other component is statistically required, given the generally acceptable χ2 values. The following hardening of the spectrum (region B of Fig. 3) reflects the gradual increase in optical depth and the almost constant value of the electron temperature. The soft temperature varies between 0.74 keV and 1.07 keV. After the periastron passage (ObsId 03-02), the spectrum shows an increase in luminosity and a high column density (region C). As the source moves towards the apastron (region D), the luminosity drops, returning to the pre-periastron trend of linear decrease, and the local absorption decreases, thus giving the softening observed in region D, whereas in the high-energy band no significant shape variation is observed.
The final stage of the outburst observed with RXTE (region E), after the ankle in the light curve, encompasses the orbital phase 1.56 − 1.73. To increase the statistics, all the PCU2 spectra were summed together and fitted together with the Swift/XRT spectrum 38. We verified that the PCU2 spectra were all compatible with each other, excluding only the expected variation in the fluxes that are separately reported in Table 3. No significant local absorption is detected in the spectrum, but there is an indication of a broader fluorescence line Fe Kα line with respect to that in the soft state. The most interesting aspect is the sudden jump in the electron temperature to values above 20 keV, occurring between phase 1.51 and 1.55, which is consistent with the apastron passage. The spectral change in the electron temperature/optical depth turns the Comptonizing corona from an optically thick to an optically thin regime. This spectral variation is statistically very significant (fixing the electron temperature at 2.7 keV would result in a reduced χ2 of 6.3), and the lower limit, at 95% confidence level, is found at 14 keV. Since the data cover the spectrum only up to 20 keV, we chose to fix this parameter to this boundary value. We note that the passage to the optically thin regime still requires a source of soft photons at a relatively high temperature. The probability of chance improvement using an F-test for the addition of the kT0 parameter is ~0.3%. The luminosity at which the spectral transition (ObsId 04-08) takes place, considering the extrapolated 0.1 − 100 keV range is (3.5 ± 0.7) × 1036 erg s-1.
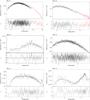 |
Fig. 7 Plot of unfolded spectra, best-fit models, and residuals in units of σ for six representative spectra. ObsId 31 and ObsId 38 also show, in red, RXTE/PCA data used to more tightly constrain the fitting model. |
Swift ObsId 39 and 40, taken during the second periastron passage, mark the end of the May outburst since the source subsequently passed to a very faint state (corresponding to a luminosity of ~6 × 1035 erg s-1). Owing to the low statistics, we were unable to constrain the broadband spectral shape; if we impose the same model of ObsId 38, we determine a value of local absorption NH ≳ 1023 cm-2 for both observations.
Another outburst is then observed between phases 2.14 and 2.27. The rising phase is characterised again by a soft spectrum and moderately high local NH in the (4−5.5) × 1022 cm-2 range (ObsId 41). The rising time of this outburst is comparable to that of the May outburst (about two days). When the source reaches the maximum peak intensity (ObsId 42), the spectral shape remains substantially unaltered up to the next periastron passage. Because the data cover only the soft X-ray range, we were unable to constrain simultaneosly the electron temperature and optical depth. For this reason, we chose to fix the former to a reference value of 2.6 keV. Quite interestingly, the spectrum and the flux appear to be consistent with the spectrum at the previous same orbital phase (e.g. ObsId 03-03). However, in contrast to that case, there is no subsequent clear decrease in the flux; the flux remains at a value of ~2 × 10⁻⁹ erg cm-2 s-1 for the following ten days.
During ObsId 47, the source is precisely at the periastron passage. The spectrum again shows an increase in local absorption and partial covering of the direct emission. This passage seems to suddenly turn off the ongoing outburst, as can be more clearly seen by the long-term ASM light curve (Fig. 1). We cannot discriminate, based on the goodness of the fit, between a Comptonized model of either high or low electron temperature, so that we report in Table 3, both spectral solutions with fixed values for the electron temperature at 2.6 keV (corresponding to a soft state model) and 20 keV (corresponding to a hard state model). ObsId 48 shows the source in a dipping state, following the periastron passage. Local absorption reaches 6 × 1023 cm-2, and the source flux shows a significant rise. A very intense iron line, of ~0.7 keV equivalent width, is also detected in the spectrum. After this dip phase, the ObsId 49 and 50 indicate that there is still significant local absorption (NH ~ (2−3) × 1023 cm-2), but the source flux decreases considerably. Figure 7 shows the unfolded models and spectra for six different phases, during and amid the two outbursts, that are representative of the spectral evolution of the source (see Table 3).
The spectral analysis of the 20 ks Chandra observation reveals an emission feature, whose energy is constrained to be between 6.30 keV and 6.44 keV, which we identify as a Fe Kα fluorescence line of neutral, or mildly ionised, iron. The line is clearly detected (F-test for chance improvement ~1%), with an upper limit to its width (σ) of 0.2 keV. The shape of the continuum emission can be described to first order by an absorbed (NH = 4.3 ± 0.3 × 1022 cm-2) power-law (photon index Γ = 1.46 ± 0.11), giving already a satisfactory description of the data (χ2 = 372, 665 d.o.f.). The presence of a high-energy cut-off is not statistically required, as a cut-off power-law only marginally improves the fit (Δχ2 = 3, for one d.o.f. more). However, to be consistent with the previous spectral model, we also show in Table 3, spectral fitting results adopting the kTe = 20 keV model constraint. In Fig. 8, we show the unfolded model, data, and residuals.
The 0.5−10 keV unabsorbed flux (2.4 × 10⁻¹⁰ erg cm-2 s-1) is close to the value obtained for the Swift ObsId 50, but the amount of local absorption is a factor of ten less. The extrapolated X-ray flux in this state is difficult to constrain, because of the uncertainty in the cut-off energy of the Comptonization. A value ~5 × 10⁻¹⁰ erg cm-2 s-1 appears however, quite reasonable, because a ratio of two for the 0.1−100 keV range to the 0.5 − 10 keV range, is derived from the fitting of the spectra in the region E of Fig. 3. The corresponding isotropic luminosity is 3.5 × 1036 erg s-1.
In this faint state, a typical type-I X-ray burst is clearly observed in the light curve. The X-ray bursts observed during the May outburst were always associated with the soft state, when the source luminosity varied between 1.4 and 5.9 × 1037 erg s-1 (Linares et al. 2010). To make a rough guess of the ratio of the time-averaged persistent to burst luminosity (α), we consider here only the collected counts during the burst, as the low quality statistics do not allow us to perform a sensible time-resolved burst spectral analysis. If the time between bursts is approximately the time duration of the Chandra observation (Δt ≈ 20 ks), this leads to α ≈ 180. This value is consistent with the values derived for some of the previous bursts (Linares et al. 2010), and points to a pure He burst, as expected from the low persistent accretion rate (Narayan & Heyl 2003).
 |
Fig. 8 Unfolded data with best-fit model and residuals in units of σ for the Chandra observation. HEG data in red, MEG data in black. |
3.3. Passage during dips: RXTE observation 03-01
The light curve of RXTE/PCA ObsId 03-01 in Fig. 9 shows strong variability: a dip phase at the start of the observation is then followed by multiple flare episodes. To track the fast spectral variability for this observation, we divided the light curve into ten, equally spaced intervals. This choice is a reasonable compromise between the fast tracking of the X-ray variability and spectra of sufficiently high signal-to-noise ratio. We used a partial covering component (pcfabs in Xspec) to model the effects of the varying absorption. We also take into account electron scattering (cabs in Xspec), by insisting that its value be equal to the NH of the pcfabs component, as done in Shirey et al. (1999). We kept the value of the interstellar NH fixed at 1 × 1022 cm-2. We used the previously discussed comptt component to describe the continuum emission. Although changes to the spectral shape could possibly take place, we assumed, as a first order approximation, that the spectral shape did not change during the dip passage (by keeping the soft photon temperature, electron temperature, and optical depth fixed to the average values found during the pre-deep observation, i.e. to 0.81 keV, 2.55 keV, 17.3, respectively). We allowed the hydrogen column density, the covering fraction of the pcfabs component, and the normalisation of the comptt component free to vary in each of the spectral fits. In some of the spectra, especially during the dip phase, a broad Gaussian line was definitely required to achieve acceptably small χ2 values.
 |
Fig. 9 Upper panel: net light curve of ObsId 03-01, showing the time intervals used for spectral analysis. Middle panel: best-fit spectral results as a function of the observed count rate; from top to bottom: unabsorbed flux of the Comptonized component in units of 10-9 erg cm-2 s-1, equivalent hydrogen column of the pcfabs fcomponent in units of 1022 cm-2, covering fraction, and equivalent width of the Fe Kα Gaussian line (if present in the best-fit model). Bottom panel: four unfolded spectra from ObsId 03-01. From top to bottom, unfolded spectra of time segments 11, 8, 2, and 5. |
This approach was successful in describing the spectral shape, with an average reduced χ2 of 1.1 (for 34/35 d.o.f.). In the left panel of Fig. 9, we show the net light curve of the observation and in the right panel the evolution of the spectral parameters. The dip phase is characterised by NH values of between 1.5 and 3.5 × 1024 cm-2, and corresponding covering fractions of between 80% and 90%. During this phase, the unabsorbed flux was ~2 × 10⁻⁹ erg cm-2 s-1, corresponding to an isotropic luminosity of a 1.4 × 1037 erg s-1. In this phase, a broad fluorescent Gaussian iron line was detected in the spectra, with equivalent widths decreasing from 600 eV to 100 eV, in correlation with the decrease in the column density value. As the source moved out of the dip, variations in the local NH tended to flatten, remaining however above 1023 cm-2. The rapid rise in the count rate, observed outside the dip phase, is mainly due to the rapid decrease in the local absorption and an increase of a factor ~3 in the intrinsic flux, while the covering fraction follows a smooth trend towards an asymptotic value of ~50%. In the bottom panel of Fig. 9, four representative unfolded spectra show different unfolded spectra.
4. Discussion
4.1. The spectral evolution of Cir X-1 during the outburst
A multi-satellite campaign of Cir X-1 from May to July 2010 tracked the spectral evolution of the source in one of its major outbursts after a long period of relative X-ray quiescence during the years 2007 − 2010. RXTE began its monitoring campaign of Cir X-1 ~ 1.5 days after the outburst’s peak at orbital phase 0.3. During the first part of the RXTE monitoring (regions A − D of Fig. 3), the spectral shape of Cir X-1 could be closely reproduced by thick Comptonized spectrum, where the average values of soft photon temperature (0.9 keV), electron temperature (2.6 keV), and optical depth (12.9) displayed relative variations of between 10% and 20%, describing a progressive hardening of the spectrum before the first periastron passage (with an increase in the optical depth) and a softening after this passage. In Iaria et al. (2005), the broadband (0.1 − 200 keV) X-ray spectrum of Cir X-1 at orbital phase 0.62 − 0.84 and a luminosity comparable to the luminosity reported for regions A and B of Fig. 3, was modelled with a soft black-body (kT ~ 0.5 keV), an optically thick Comptonized component (kT0, kTe, τ ≈ 1.1 keV, 2.65 keV, and 12, respectively) and a series of absorption edges at low energies of highly ionised ions. We found that the cut-off in the Comptonization, determined by the electron temperature and optical depth, was remarkably consistent with values in that spectrum. In our analysis, we were unable to assess the presence of either an additional softer component or a warm absorber, but the value we derived for the soft photon temperature appears to be the average the two soft temperatures (black-body temperature and kT0 value) found in Iaria et al. (2005).
Except for the first observation, ObsId 01-00, (NH = 3.2 ± 1.1 × 1022 cm-2), and the observation following the dip behaviour, ObsId 03-02 (NH = 5.1 ± 0.5 × 1022 cm-2), all the other RXTE spectra are consistent with a relatively lower value of the interstellar absorption ( ≲ 2 × 1022 cm-2). It is interesting to question how low this value could effectively be, as it is the only way of constraining the extent of the local absorber. The XRT data provide a far more comprehensive coverage at low energies than PCA spectra. From Table 3, we note that ObsId 34 and ObsId 38 have the lowest column densities, that point to a possible lower limit value of 1.0 × 1022 cm-2, which was therefore adopted in the fits, when either the parameter could not be constrained or we had evaluated the presence of a partial covering component3.
The RXTE/PCA ObsId 03-01 (Sect. 3.3) indicated that the periastron passage significantly alters the spectral shape, which is mostly affected by the variability of the cold absorber. The simultaneous presence of a ionised warm absorber could not be assessed given the lack of spectral resolution (D’Aí et al. 2007). Absorption is however incomplete, and ~10% of the primary emission remains unabsorbed. This behaviour, which was previously observed when the source was in a bright persistent, state, depends on time-dependent local conditions of the medium, where interactions with the companion star causes turbulent star losses that may partially overfill the outer disk region’s of the accreting source (Ding et al. 2006). During this passage the continuum flux also significantly varies and reaches values comparable with the peak flux of the outburst. It is, perhaps, not coincidental that the dipping phase is followed by a multiple flaring episode, with the flux of the source rising by a factor of about three in about 1000 s (see also D’Aí et al. 2007), so that what is actually accreted during the flaring could be part of the same matter that caused the dipping (see also Bozzo et al. 2011, for a convincing application of this scenario). However, since the slope of the decay remains the same in both regions B and C of Fig. 3, and the spectral shape in these two regions is also consistent (apart from the softening and hardening trends that we found), we conclude that the transient accretion phase at the dipping is restricted only to the periastron passage and does not alter the overall outbursting process.
When Swift began observing Cir X-1 at phase 1.32, the source was still in the optically thick regime. Combined XRT and PCU2 fits significantly improved the determination of the comptt spectral parameters, providing tight constraints on the value of the local absorber, that monotonically decreased from phase 1.32 to phase 1.68. During phases 1.52 − 1.62, with a 2 − 20 keV flux of ~5.4 × 10⁻¹⁰ erg s-1, the spectrum changed significantly, as the Comptonization cut-off energy abruptly moved out of band. The corresponding luminosity was ~2% of the Eddington limit (we assume LEdd = 1.8 × 1038 erg s-1 for a 1.4 M⊙ NS). These state transitions are also often observed in some persistent and transient accreting NS low-mass binaries at this energy threshold (Gladstone et al. 2007). The peculiar system XTE J1701 − 462, which is the only transient NS that started its outburst showing classical Z-type behaviour and gradually passing to the atoll state at lower accretion rates, showed its transition to the hard state at the same Eddington luminosity (Homan et al. 2010). At very high accretion levels, Cir X-1 showed timing characteristics that are similar to the Z-class sources (Shirey et al. 1999; Boutloukos et al. 2006), as well as a state closer to the hard/atoll behaviour (Oosterbroek et al. 1995). The present analysis shows the first evidence of a clear passage from the soft to the hard state, constraining the luminosity threshold at which it happens.
The state transition is also visible as a change in the slope of the count rate (flux) versus time plot (Fig. 2). These features (which are mostly referred to as knees, as the slope is mostly observed to steepen) are widely observed, e.g. during the final stages of the outbursts of accreting ms X-ray pulsars (defined as brinks by Powell et al. 2007,when the decay passes from exponential to linear), but no evident and corresponding change in the spectral shape is generally observed. The physical mechanism behind these changes in slope may therefore not be unique; while the onset of a quasi-propeller phase is reasonable for the case of accreting ms pulsars, whose accretion flow can be channeled by the NS magnetic field, as discussed in Hartman et al. (2011), in the case of Cir X-1 the ankle appears connected with a sudden change in the spectral state and a related drop in flux, as shown by our spectral analysis.
The flux decrease during this hard state is very rapid, being a factor ~ ten in less than three days (from ObsId 04-08 to ObsId 39, Table 3). After the second periastron passage, a greater mass transfer may have caused the triggering of the second outburst. The minor outburst evolves much more slowly with respect to the major outburst. After ten days, no significant decrease in luminosity is observed (between ObsId 41 and 46). The spectral shape is consistent with the region B parameters of the May outburst. However, at the third periastron passage, the outburst turns off. A brightening is observed at phase 3.11, with probably similar characteristics of ObsId 03-01. The last observations point to an almost steady state of accretion at flux levels (2 − 3) × 10-10 erg s-1.
4.2. The mechanism behind the major outburst: analogies with the Be XRB systems
After several years of the monitoring, from 1996 to 2005, of the steady bright X-ray state of Cir X-1, we have found that the source displays a substantially different long-term behaviour, where several-month-long periods of relative faintness are interrupted by bright outbursts, whose luminosity peaks can reach Crab-levels. This behaviour is reminiscent of the X-ray activity observed at the end of seventies (Kaluzienski et al. 1976), for which Murdin et al. (1980) proposed a model involving the orbital precession by 10°/year of a highly eccentric orbit (e = 0.8 ± 0.1). Today’s most widespread interpretation of the outbursting behaviour of accreting X-ray sources is contained in the disk instability model (DIM, Lasota 2001). According to this model, a change in the opacity caused by the ionisation of hydrogen causes a dramatic change in the viscosity of disk matter. This instability propagates at the viscous timescales (which explains the measured rise times of the order of days). When the viscosity allows for the rapid accretion of matter, the outburst reaches its peak, and following evolution (tens of days) is driven by the emptying of the disk, at least for the regions where viscosity remains sufficiently high. An exponential, or linear, light-curve decay is predicted in the case the outer disk radius is kept, or not, in this high viscosity regime (King & Ritter 1998; Shahbaz et al. 1998).
The brightest outbursts in Cir X-1 appear to be clocked with the periastron passage, and it is reasonable to argue that what drives the instability is a sudden change in the surface mass density at the outer edge of the disk. A partial disruption of the outer disk edge due to a tidal interaction, or a periastron driven enhanced accretion (Regös et al. 2005; Church et al. 2009), may be mechanisms that can make this happen, although it would remain an open question why this mechanism does not operate at every passage, given its dependence only on the system particular geometry. The scenario in which part of the disk outer mass is stripped by a previous close NS-companion encounter is similarly unable to provide a consistent trigger of the outburst, since any debris would probably have already been expelled from the system at the following passage, given the high orbital periodicity. An alternative explanation of the episodic occurrence is possible if we associate the episodes of enhanced accretion with a variable structure present around the companion star in a scenario similar to the classical picture of Be X-ray binary systems (Be XRBs). In these systems, the accreted mass is not directly stripped by means of steady accretion from the inner Lagrangian point, but the compact object accretes as it swaps the regions of a steady decretion disk around the companion star. Decretion disks are variable in both density and size, and they constitute the only efficient mechanism for transferring mass to a compact object, when the companion star is neither a supergiant with a strong wind, nor a low-mass star filling its Roche lobe. Cir X-1 shares, in fact, some common characteristics with the Be XRBs class, such as eccentric orbit, high-mass companion, long orbital period, enhanced accretion at the periastron passage, as well as strong X-ray variability on short and long timescales. The hypothesis that a circumstellar decretion disk could effectively be present was first explored by Clarkson et al. (2004), in order to explain the short dip intervals that were observed in the X-ray light curve scattered around the zero phase. Jonker et al. (2007) studied spectroscopic and photometric observation in the I-band; the optical spectrum showed not only broad absorption Paschen lines, but also emission Paschen lines when the phase was near zero. If these lines are produced in the companion photosphere, then a comparison with typical supergiant mid-B spectral type companion star provides the best fit to the optical spectrum (but the possible spectral type is uncertain up to the A0 class). However Be XRBs have earlier spectral-type companions; the distribution of Be spectral classes in Be XRB is quite strongly peaked around the B0 spectral class (Negueruela & Coe 2002; McBride et al. 2008), with no examples after the B3 spectral class. Isolated Be stars do also show later spectral types, up to B8/B9; it is argued that this is not a selection effect, but depends on the binary interaction of the B supergiant, which can efficiently lose spin angular momentum before the onset of the X-ray active phase (Portegies Zwart 1995). Most of the Be XRBs NS have high-B fields (>1011 G), and appear, therefore, as accretion-powered pulsars. Both of these properties clearly imply that Cir X-1 is an odd candidate member of this class, owing probably to the physical circumstance that Cir X-1 has a lower magnetic field, as indicated by the absence of X-ray pulsations and presence of bursting activity. Clarkson et al. (2004) suggested that the low B-field could be due to a buried magnetic field undergoing a super-Eddington accretion phase. However, Cir X-1 has a soft spectral shape during the outburst, whereas Be XRB are mostly hard X-ray emitters, showing typically power-law spectra with high-energy (above 10 keV) cut-offs. In addition Cir X-1 remains steadily very soft during both the rising phase and the outburst’s decline. A likely explanation of this is in the low B-field of the NS, so that accreting matter is inefficiently channelled into the magnetic caps, but uniformly spread across the boundary layer via an accretion disk. The dissipation region is optically thick, resulting in a thermal, soft spectrum, as demonstrated by our spectral analysis. We note that the Be X-ray source, XRB A0538 − 66, which has a similar orbital period and an apparently high eccentricity (Charles et al. 1983) to Cir X-1, also showed during an outburst episode a similar soft spectral shape and variable local extinction (Ponman et al. 1984), recalling the behaviour observed in this analysis.
4.3. Physical parameters associated with the May outburst
If we extrapolate the linear decay of the RXTE/PCA light curve (Fig. 6) of the outburst at phase passage 0.1, ~1.5 days before the actual RXTE first observation, we estimate a peak unabsorbed bolometric flux of 9.2 × 10⁻⁹ erg s-1 cm-2, corresponding to a luminosity of 6.7 × 1037 erg s-1. Considering the 23 day interval of the outburst, before the change in the linear slope of the light curve, we derive a fluence of ~8 × 10⁻³ erg. The total mass accreted by the NS during this phase is assumed to be ~7.3 × 10²³ g, where the efficiency of the accretion process η = 0.1. Linear decays in the light curves of LMXBs outbursting sources should be connected only with a partial ionisation of the inner accretion disk, and the outburst is prevented from swallowing all of the disk. The disk is thus separated into two zones: a inner hot zone, at high viscosity, and an outer cold zone, at low viscosity (King & Ritter 1998). From the calculations shown in Shahbaz et al. (1998), we can derive the physical characteristics for the hot zone disk 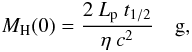 (1)where MH is the mass of the hot zone, Lp is the outburst’s peak luminosity, t1/2 is the time needed to reduce to a half the peak luminosity, η is the accretion efficiency and c is the light velocity
  (2)where B1 is a parameter whose value is 4 × 10⁵ (cgs), ν is the kinematic viscosity at the edge of the heating front
 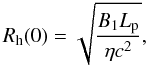 (3)where Rh(0) is the hot zone disk radius at time 0.
We thus derive the values 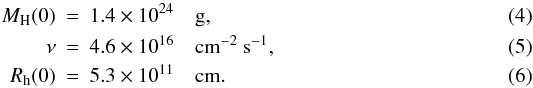 The mass of the hot zone corresponds to twice the value we derived from the total accreted mass needed to power the observed flux, so that when Cir X-1 enters into the hard state, a significant fraction of the disk mass must still be present.
4.4. The minor outburst
The second outburst, which was covered only by Swift, differed significantly from the May outburst. It did not start close to the phase-zero passage, but at phase passage ~2.27. The unabsorbed fluxes associated with the spectra do not show a clear declining trend (see Fig. 6) and are compatible with an average flux in the 1−10 keV range of ~1.84 × 10⁻⁹ erg s-1 cm-2, whereas in the extrapolated 0.1−100 keV range we derive a bolometric flux of ~2.1 × 10⁻⁹ erg s-1 cm-2, corresponding to a luminosity of 1.5 × 1037 erg s-1. The outburst has a duration of about ten days and a total fluence of ~ 1.8 × 10⁻³ erg s-1, implying an accreted mass of ~1.4 × 10²³ g, thus a factor of more than five lower than the major outburst. The peak flux is also similarly lower than the peak flux of the major outburst. From the previous section, we note that the accreted mass during this outburst is about 20% of the total mass of the hot zone at the end of the May outburst.
The first snapshot of the outburst reveals a moderate value of local absorption (ObsId 41, Table 3), possibly associated with a passage through a thick medium. This was not observed during the first periastron passage, where accretion enhancement was strictly confined to the 0.1 phase. It is, however, reasonable to assume that mass outflow from either the companion star or its decretion disk, cause part of the ejecta to be straggled in the orbital plane where it can be recaptured by the NS as it passes by (see Lajoie & Sills 2011). The density of these ejecta would probably be bound with the history of previous accretion phases. Another intertwined effect is the physical conditions in the accretion disk. The first passage has a hot accretion disk extending close to the NS surface, whose high viscosity allows matter to rapidly accrete when matter is captured within the hot accretion region. At the second passage, most of the disk is in the cold, low viscosity regime, and the spreading of the mass raises the temperature of the irradiated cold disk, thus triggering a new outburst. The decay of the outburst, with an almost flat slope in the following days, and a very steep decline observed at the periastron passage are, however, difficult to explain according to the classical disk-instability model. The disk returns to the low accretion regime without showing any clear trend, at least according to the observational sample at hand. In Calvelo et al. (2010), a bright radio flaring was claimed at this third passage, which may be connected with the ejection of the inner part of the disk, which in turn would not allow to longer sustain the outburst.
4.5. Comparison with previous Chandra observations
Chandra observed the source on 4 July 2010, 11 days after the drop in luminosity that marked the sudden end of the outburst at orbital phase 0.1. Compared to the set of Swift observations of the hard X-ray phase, the spectrum no longer showed evidence of large local absorption. The spectrum appears featureless, with the exception of probably a narrow Gaussian line at energies compatible with neutral iron Kα emission. The origin of this line is probably due to fluorescence from the local cold absorber. A disk reflection origin appears unlikely because relativistically distorted lines are substantially broader, quite independently of the luminosity state of the accreting source (D’Aì et al. 2010). Cir X-1 has never been shown to display broad iron lines, and a likely explanation could be either a high inclination angle of the system, which would reduce the reflection contribution relative to other continuum components, or an accretion disk that does not extend close to the NS. To support the interpretation of a link between the cold absorber and the iron line, we used the calculations of the iron-line equivalent-width of Yaqoob et al. (2010). For a spherically symmetric local absorber of equivalent column density ~3 × 1022 cm-2, an incident power-law index of 1.46 ± 0.11, an iron abundance relative to hydrogen of 4.67 × 10⁻⁵, the expected EW of the line is 28 ± 1 eV, which is consistent with the value derived from Chandra data.
The extropolated luminosity is in the (1.26−2.11) × 1036 erg s-1 range, depending on the model used to describe the spectrum. This value is about a factor of two higher than that derived from the Swift observation made just before the onset of the outburst (see ObsId 40 in Table 3, with a general agreement between the spectral shape in the two observations). A Chandra observation in January 2005 at orbital phase 0.10, lasting approximately the same time as the present observation, when the source was two times fainter, showed emission lines from H-like and He-like ions of S, Si, Ar, Ca, and Fe (Iaria et al. 2008). Another observation in June 2005, at phases 0.22 − 0.26 revealed both emission and absorption features during turbulent flaring episodes, which typically lasted several hours (D’Aí et al. 2007). The source displayed significant strong rapid X-ray variability, in both the continuum shape and the pattern of emission/absorption lines, covering a (1.6 − 8.5) × 10-10 erg s-1 cm-2 flux range. The lack of these features in the present observation are most probably related to the changing density environment through which the compact object moves. This would also be consistent with the continuum shape, as in the two 2005 Chandra observations a partial covering component was needed to model the continuum shape, with values in the local extinction between 6.3 × 1022 cm-2 (Iaria et al. 2008) and (8 − 20) × 1022 cm-2 range (D’Aí et al. 2007). We propose that part of the local embedding neutral matter could be photo-ionised near the emitting X-ray source as observed in the 2005 observations, while in the present observation the medium crossed by the NS during this orbital passage could be either much less dense or far more distant. Interestingly, recent radio detections seem to provide further support for this phase-dependent effect, whose radio compact emission from Cir X-1 is also confined to the 0.1 − 0.5 phase range, while the passage from apastron to periastron is radio-faint (Moin et al. 2011).
5. Summary
After a two-year long period of X-ray quiescence (Lx ≲ 1035 erg s-1), Cir X-1 went into a bright outburst in May 2010. This outburst lasted for ~22 days, and its spectral shape is clearly consistent with an optically thick thermal Comptonization. During the outburst, at the periastron passage, clear dips in the light curve and rapidly varying local absorption were both observed. The whole light curve could be fitted by two linear decays joined by an ankle that marks at the same time a state transition to an optically thin regime, at a luminosity level corresponding to ~2% LEdd. After this transition, the flux decrease became steeper, reaching a minimum flux of 0.1% LEdd. After five days, a second outburst started, with a peak flux of 7% LEdd. For the following ten days, Cir X-1 underwent marginal variations in flux and spectral shape. This outburst declined steeply in intensity after ten days from its onset, following a periastron passage. We conjecture that a driver of the outburst sporadic recurrence might have been a variable decretion disk around the companion star, by analogy with the Be XRB class. A Chandra observation at the end of this long outbursting phase, at phase 0.6, has revealed that both the bursting activity persisted and a lack of photo-ionised emitting/absorbing plasma.
Online material
Log of the RXTE observations.
Log of the Swift/XRT observations.
Spectral best-fit results.
We note, here, that calculating the phase passage according to the ephemeris based on the occurrence of the X-ray dips (Clarkson et al. 2004) would result in very different phase value (a phase difference of ~0.5) for the outburst start time. Starting from 2004, we verified that Nicolson’s radio-based ephemeris are able to predict the start of most of the X-ray outbursts, while the Clarkson’s ephemeris shows a progressive and clear lagging of the zero phase with respect to the peaks of the outbursts. Because of this discrepancy, we refer, hereafter, only to the orbital-phase calculations based on the radio ephemeris.
This parameter (expressed in units of 1022 cm-2), however, depends on the adopted value for elements cross-sections and abundances. Fitting the XRT ObsId34 spectrum (which has the highest quality statistics), we obtained, using the bcmc cross-sections (Balucinska-Church & McCammon 1992), 1.60 ± 0.24 (abundances from Wilms et al. 2000; and Asplund et al. 2009) and 1.68 ± 0.26 (abundances from Lodders 2003); using the vern cross-sections (Verner et al. 1996), we obtained 1.66 ± 0.24 (abundances from Wilms et al. 2000; and Asplund et al. 2009), and 1.74 ± 0.26 (abundances from Lodders 2003). Calculations using the LAB HI survey (Kalberla et al. 2005) and the DL database (Dickey & Lockman 1990) result in an average value of 1.49 and 1.84, respectively. The value derived from the interstellar column density towards Cir X-1 become compatible with that expected from the radio HI maps.
Acknowledgments
Authors express their gratitude to Dr. H. Tananbaum for making possible the Chandra DDT observations and to Dr. N. Schulz for kind help and assistance in the Chandra observation planning and set-up configuration. We thank N. Gehrels and the Swift team for their prompt response in carrying out the follow-up observations of Cir X-1. This research has made use of the XRT Data Analysis Software (XRTDAS) developed under the responsibility of the ASI Science Data Center (ASDC), Italy. A. Papitto acknowledges the support of the operating program of Regione Sardegna (European Social Fund 2007-2013), L.R.7/2007, Promoting scientific research and technological innovation in Sardinia, as well as of the grants AYA2009-07391 and SGR2009-811, and of the Formosa program TW2010005 and iLINK program 2011-0303. E. Egron acknowledges the support of the Initial Training Network ITN 215212: Black Hole Universe funded by the European Community. Authors acknowledge financial contribution from the agreement ASI-INAF I/009/10/0.
References
- Arnaud, K. A. 1996, in Astronomical Data Analysis Software and Systems V, ed. G. H. Jacoby, & J. Barnes, ASP Conf. Ser., 101, 17 [Google Scholar]
- Asplund, M., Grevesse, N., Sauval, A. J., & Scott, P. 2009, ARA&A, 47, 481 [NASA ADS] [CrossRef] [Google Scholar]
- Balucinska-Church, M., & McCammon, D. 1992, ApJ, 400, 699 [NASA ADS] [CrossRef] [Google Scholar]
- Boutloukos, S., van der Klis, M., Altamirano, D., et al. 2006, ApJ, 653, 1435 [NASA ADS] [CrossRef] [Google Scholar]
- Bozzo, E., Giunta, A., Cusumano, G., et al. 2011, A&A, 531, A130 [NASA ADS] [CrossRef] [EDP Sciences] [Google Scholar]
- Brandt, W. N., & Schulz, N. S. 2000, ApJ, 544, L123 [NASA ADS] [CrossRef] [Google Scholar]
- Brandt, W. N., Fabian, A. C., Dotani, T., et al. 1996, MNRAS, 283, 1071 [NASA ADS] [CrossRef] [Google Scholar]
- Burrows, D. N., Hill, J. E., Nousek, J. A., et al. 2005, Space Sci. Rev., 120, 165 [NASA ADS] [CrossRef] [Google Scholar]
- Calvelo, D. E., Fender, R., Broderick, J., et al. 2010, The Astronomer’s Telegram, 2699, 1 [NASA ADS] [Google Scholar]
- Charles, P. A., Booth, L., Densham, R. H., et al. 1983, MNRAS, 202, 657 [NASA ADS] [Google Scholar]
- Church, R. P., Dischler, J., Davies, M. B., et al. 2009, MNRAS, 395, 1127 [NASA ADS] [CrossRef] [Google Scholar]
- Clarkson, W. I., Charles, P. A., & Onyett, N. 2004, MNRAS, 348, 458 [NASA ADS] [CrossRef] [Google Scholar]
- D’Aí, A., Iaria, R., Di Salvo, T., Lavagetto, G., & Robba, N. R. 2007, ApJ, 671, 2006 [NASA ADS] [CrossRef] [Google Scholar]
- D’Aì, A., di Salvo, T., Ballantyne, D., et al. 2010, A&A, 516, A36 [NASA ADS] [CrossRef] [EDP Sciences] [Google Scholar]
- Dickey, J. M., & Lockman, F. J. 1990, ARA&A, 28, 215 [NASA ADS] [CrossRef] [MathSciNet] [Google Scholar]
- Ding, G. Q., Qu, J. L., & Li, T. P. 2006, AJ, 131, 1693 [NASA ADS] [CrossRef] [Google Scholar]
- Fender, R. P., & Hendry, M. A. 2000, MNRAS, 317, 1 [NASA ADS] [CrossRef] [Google Scholar]
- Gladstone, J., Done, C., & Gierliński, M. 2007, MNRAS, 378, 13 [Google Scholar]
- Goss, W. M., & Mebold, U. 1977, MNRAS, 181, 255 [NASA ADS] [CrossRef] [Google Scholar]
- Hartman, J. M., Galloway, D. K., & Chakrabarty, D. 2011, ApJ, 726, 26 [NASA ADS] [CrossRef] [Google Scholar]
- Heinz, S., Schulz, N. S., Brandt, W. N., & Galloway, D. K. 2007, ApJ, 663, L93 [NASA ADS] [CrossRef] [Google Scholar]
- Homan, J., van der Klis, M., Fridriksson, J. K., et al. 2010, ApJ, 719, 201 [NASA ADS] [CrossRef] [Google Scholar]
- Iaria, R., Burderi, L., Di Salvo, T., La Barbera, A., & Robba, N. R. 2001a, ApJ, 547, 412 [NASA ADS] [CrossRef] [Google Scholar]
- Iaria, R., Di Salvo, T., Burderi, L., & Robba, N. R. 2001b, ApJ, 561, 321 [NASA ADS] [CrossRef] [Google Scholar]
- Iaria, R., Di Salvo, T., Robba, N. R., & Burderi, L. 2002, ApJ, 567, 503 [NASA ADS] [CrossRef] [Google Scholar]
- Iaria, R., Spanò, M., Di Salvo, T., et al. 2005, ApJ, 619, 503 [NASA ADS] [CrossRef] [Google Scholar]
- Iaria, R., D’Aí, A., Lavagetto, G., et al. 2008, ApJ, 673, 1033 [NASA ADS] [CrossRef] [Google Scholar]
- Jonker, P. G., & Nelemans, G. 2004, MNRAS, 354, 355 [NASA ADS] [CrossRef] [Google Scholar]
- Jonker, P. G., Nelemans, G., & Bassa, C. G. 2007, MNRAS, 374, 999 [NASA ADS] [CrossRef] [Google Scholar]
- Kalberla, P. M. W., Burton, W. B., Hartmann, D., et al. 2005, A&A, 440, 775 [NASA ADS] [CrossRef] [EDP Sciences] [Google Scholar]
- Kaluzienski, L. J., Holt, S. S., Boldt, E. A., & Serlemitsos, P. J. 1976, ApJ, 208, L71 [NASA ADS] [CrossRef] [Google Scholar]
- King, A. R., & Ritter, H. 1998, MNRAS, 293, L42 [NASA ADS] [CrossRef] [Google Scholar]
- Lajoie, C.-P., & Sills, A. 2011, ApJ, 726, 67 [NASA ADS] [CrossRef] [Google Scholar]
- Lasota, J.-P. 2001, New Astron. Rev., 45, 449 [NASA ADS] [CrossRef] [Google Scholar]
- Linares, M., Watts, A., Altamirano, D., et al. 2010, ApJ, 719, L84 [NASA ADS] [CrossRef] [Google Scholar]
- Lodders, K. 2003, ApJ, 591, 1220 [NASA ADS] [CrossRef] [Google Scholar]
- McBride, V. A., Coe, M. J., Negueruela, I., Schurch, M. P. E., & McGowan, K. E. 2008, MNRAS, 388, 1198 [NASA ADS] [CrossRef] [Google Scholar]
- Mignani, R. P., De Luca, A., Caraveo, P. A., & Mirabel, I. F. 2002, A&A, 386, 487 [NASA ADS] [CrossRef] [EDP Sciences] [Google Scholar]
- Miller-Jones, J. C. A., Moin, A., Tingay, S. J., et al. 2012, MNRAS, 419, L49 [NASA ADS] [Google Scholar]
- Moin, A., Reynolds, C., Miller-Jones, J. C. A., et al. 2011, MNRAS, 414, 3551 [NASA ADS] [CrossRef] [Google Scholar]
- Murdin, P., Jauncey, D. L., Lerche, I., et al. 1980, A&A, 87, 292 [NASA ADS] [Google Scholar]
- Narayan, R., & Heyl, J. S. 2003, ApJ, 599, 419 [NASA ADS] [CrossRef] [Google Scholar]
- Negueruela, I., & Coe, M. J. 2002, A&A, 385, 517 [NASA ADS] [CrossRef] [EDP Sciences] [Google Scholar]
- Nicolson, G. D. 2007, The Astronomer’s Telegram, 985, 1 [NASA ADS] [Google Scholar]
- Oosterbroek, T., van der Klis, M., Kuulkers, E., van Paradijs, J., & Lewin, W. H. G. 1995, A&A, 297, 141 [NASA ADS] [Google Scholar]
- Papitto, A., Bozzo, E., D’Ai’, A., et al. 2010, The Astronomer’s Telegram, 2653, 1 [NASA ADS] [Google Scholar]
- Parkinson, P. M. S., Tournear, D. M., Bloom, E. D., et al. 2003, ApJ, 595, 333 [NASA ADS] [CrossRef] [Google Scholar]
- Ponman, T. J., Skinner, G. K., & Bedford, D. K. 1984, MNRAS, 207, 621 [NASA ADS] [Google Scholar]
- Portegies Zwart, S. F. 1995, A&A, 296, 691 [NASA ADS] [Google Scholar]
- Powell, C. R., Haswell, C. A., & Falanga, M. 2007, MNRAS, 374, 466 [NASA ADS] [CrossRef] [Google Scholar]
- Regös, E., Bailey, V. C., & Mardling, R. 2005, MNRAS, 358, 544 [NASA ADS] [CrossRef] [Google Scholar]
- Schulz, N. S., & Brandt, W. N. 2002, ApJ, 572, 971 [NASA ADS] [CrossRef] [Google Scholar]
- Shahbaz, T., Charles, P. A., & King, A. R. 1998, MNRAS, 301, 382 [NASA ADS] [CrossRef] [Google Scholar]
- Shirey, R. E., Levine, A. M., & Bradt, H. V. 1999, ApJ, 524, 1048 [NASA ADS] [CrossRef] [Google Scholar]
- Soleri, P., Heinz, S., Fender, R., et al. 2009, MNRAS, 397, L1 [NASA ADS] [CrossRef] [Google Scholar]
- Stewart, R. T., Caswell, J. L., Haynes, R. F., & Nelson, G. J. 1993, MNRAS, 261, 593 [NASA ADS] [CrossRef] [Google Scholar]
- Tennant, A. F., Fabian, A. C., & Shafer, R. A. 1986, MNRAS, 221, 27 [NASA ADS] [CrossRef] [Google Scholar]
- Titarchuk, L. 1994, ApJ, 434, 570 [NASA ADS] [CrossRef] [Google Scholar]
- Tudose, V., Fender, R. P., Kaiser, C. R., et al. 2006, MNRAS, 372, 417 [NASA ADS] [CrossRef] [Google Scholar]
- Verner, D. A., Ferland, G. J., Korista, K. T., & Yakovlev, D. G. 1996, ApJ, 465, 487 [NASA ADS] [CrossRef] [Google Scholar]
- Wilms, J., Allen, A., & McCray, R. 2000, ApJ, 542, 914 [NASA ADS] [CrossRef] [Google Scholar]
- Yaqoob, T., Murphy, K. D., Miller, L., & Turner, T. J. 2010, MNRAS, 401, 411 [NASA ADS] [CrossRef] [Google Scholar]
All Tables
All Figures
|
Fig. 1 Daily-averaged ASM light curve (2 − 12 keV range) of Cir X-1 between 2010 April 19 and 2010 July 13. Markers for the RXTE (filled circles), Swift (open circles), and Chandra (diamond) observations are superimposed. Phase zero orbital passages are marked by grid lines. |
| In the text | |
|
Fig. 2 Best-fit model for the RXTE light curve (upper panel) and residuals in units of standard deviations (lower panel). Each point represents the average net (2 − 60 keV) light-curve count-rate in one ObsId. Time 0 corresponds to TJD 15 327.0261. |
| In the text | |
|
Fig. 3 Hardness ratios of the May 2010 Cir X-1 outburst. Each point represents the ratio of the average count rates in a 256 s time interval for the energy bands reported in y-labels. |
| In the text | |
|
Fig. 4 Light curve (time bin of 200 s) of the Swift/XRT observations of Cir X-1, with indications of the ObsIds of Table 2. |
| In the text | |
|
Fig. 5 Chandra light-curve (sum of first order HEG and MEG counts) of the Cir X-1 observation. Time zero corresponds to TJD 15 381.21190. Bin time is 20 s. Insert panel: snapshot of the type-I X-ray burst, bin time is 2 s. |
| In the text | |
|
Fig. 6 2 − 20 keV unabsorbed flux (in units of 10-10 erg cm-2 s-1) as a function of the orbital phase. |
| In the text | |
|
Fig. 7 Plot of unfolded spectra, best-fit models, and residuals in units of σ for six representative spectra. ObsId 31 and ObsId 38 also show, in red, RXTE/PCA data used to more tightly constrain the fitting model. |
| In the text | |
|
Fig. 8 Unfolded data with best-fit model and residuals in units of σ for the Chandra observation. HEG data in red, MEG data in black. |
| In the text | |
|
Fig. 9 Upper panel: net light curve of ObsId 03-01, showing the time intervals used for spectral analysis. Middle panel: best-fit spectral results as a function of the observed count rate; from top to bottom: unabsorbed flux of the Comptonized component in units of 10-9 erg cm-2 s-1, equivalent hydrogen column of the pcfabs fcomponent in units of 1022 cm-2, covering fraction, and equivalent width of the Fe Kα Gaussian line (if present in the best-fit model). Bottom panel: four unfolded spectra from ObsId 03-01. From top to bottom, unfolded spectra of time segments 11, 8, 2, and 5. |
| In the text | |
Current usage metrics show cumulative count of Article Views (full-text article views including HTML views, PDF and ePub downloads, according to the available data) and Abstracts Views on Vision4Press platform.
Data correspond to usage on the plateform after 2015. The current usage metrics is available 48-96 hours after online publication and is updated daily on week days.
Initial download of the metrics may take a while.