Fig. 9

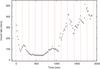
Upper panel: net light curve of ObsId 03-01, showing the time intervals used for spectral analysis. Middle panel: best-fit spectral results as a function of the observed count rate; from top to bottom: unabsorbed flux of the Comptonized component in units of 10-9 erg cm-2 s-1, equivalent hydrogen column of the pcfabs fcomponent in units of 1022 cm-2, covering fraction, and equivalent width of the Fe Kα Gaussian line (if present in the best-fit model). Bottom panel: four unfolded spectra from ObsId 03-01. From top to bottom, unfolded spectra of time segments 11, 8, 2, and 5.

Current usage metrics show cumulative count of Article Views (full-text article views including HTML views, PDF and ePub downloads, according to the available data) and Abstracts Views on Vision4Press platform.
Data correspond to usage on the plateform after 2015. The current usage metrics is available 48-96 hours after online publication and is updated daily on week days.
Initial download of the metrics may take a while.