Fig. 3
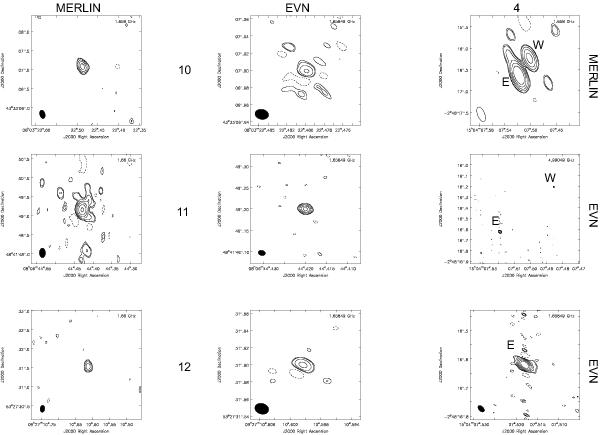
The first two columns present MERLIN and EVN 18 cm reconstructed maps. The third column shows the MERLIN 18 cm map of source 4 in the first row. The second row shows the EVN 6 cm map including the eastern and western components. In the third row we present a close-up of the eastern component in the EVN 18 cm map. The western component was not detected. We present maps of the cleaned images of the detected sources (detection threshold 3σ). Contours refer to − 3 (dashed), 3, 4, 8, 16, ... times the σ in the images. The σ values are given in Table 3. The beams are indicated in the bottom left corner of the maps. North is up, East is left.
Current usage metrics show cumulative count of Article Views (full-text article views including HTML views, PDF and ePub downloads, according to the available data) and Abstracts Views on Vision4Press platform.
Data correspond to usage on the plateform after 2015. The current usage metrics is available 48-96 hours after online publication and is updated daily on week days.
Initial download of the metrics may take a while.