Fig. 2
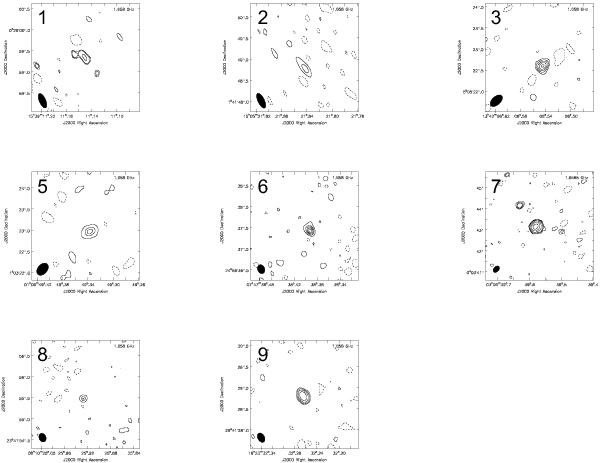
Maps of the MERLIN 18 cm reconstructed images of the detected sources (detection threshold 3σ). Contours refer to − 2 (dashed), 2, 3, 4, 5, and 6 times the σ in the image. Except for sources 7 and 9, for which the contours refer to −2, 2, 3, 4, 8, 16, 32, ... times the σ. All σ values are given in Table 3. The beams are indicated in the bottom left corner of the maps. North is up, East is left. Sources with EVN follow-up observations are shown in Fig. 3.
Current usage metrics show cumulative count of Article Views (full-text article views including HTML views, PDF and ePub downloads, according to the available data) and Abstracts Views on Vision4Press platform.
Data correspond to usage on the plateform after 2015. The current usage metrics is available 48-96 hours after online publication and is updated daily on week days.
Initial download of the metrics may take a while.