Fig. 8
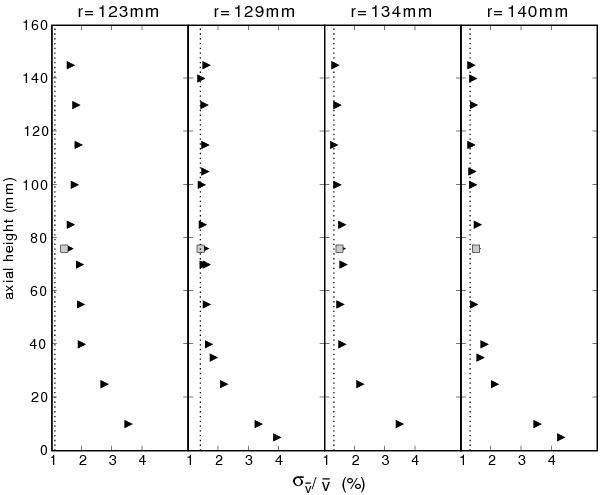
Azimuthal velocity fluctuation levels, σvθ/⟨vθ⟩, near the ring gap for the QK(q = 1.9) profile at Re = 5 × 10⁵ shown in Fig. 7. The radial locations of the scans are diagrammed in Fig. 4. Triangles are the QK(q = 1.9) profile. Shown for comparison are the solid body levels, dotted lines and one axial location for a QK(Ekman) profile, squares. Note that in the r = 123 mm panel, the solidbody line nearly overlaps the left plot border.
Current usage metrics show cumulative count of Article Views (full-text article views including HTML views, PDF and ePub downloads, according to the available data) and Abstracts Views on Vision4Press platform.
Data correspond to usage on the plateform after 2015. The current usage metrics is available 48-96 hours after online publication and is updated daily on week days.
Initial download of the metrics may take a while.