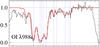
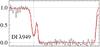
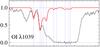
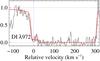
Fig. 1
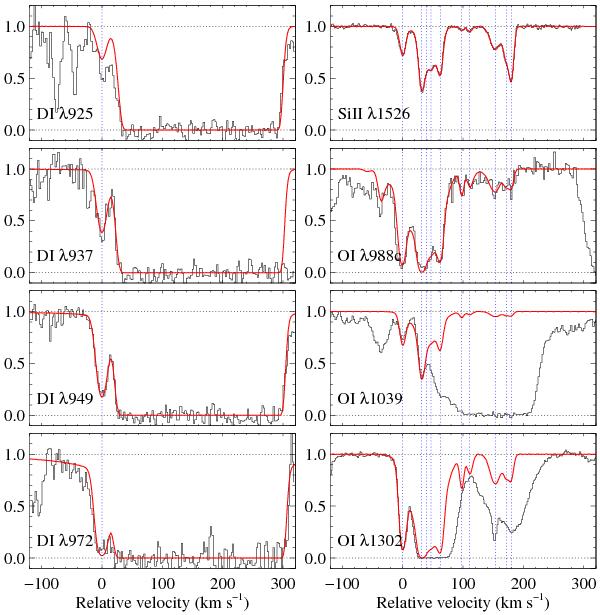
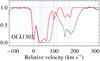
Velocity plots of D i, O i, and Si ii lines (black). The best-fit synthetic spectrum is superimposed in red. Vertical lines indicate the position of the different components. The profiles for D iλ925 and D iλ972 were computed using the derived parameters but were not used in the fitting process, the former being contaminated by absorption from the Ly-α forest and the latter being saturated. We also note that the vertical lines and the velocity scale of the O iλ988 panel correspond to the strongest (O iλ988.7) of the three transitions that produce the profile.
Current usage metrics show cumulative count of Article Views (full-text article views including HTML views, PDF and ePub downloads, according to the available data) and Abstracts Views on Vision4Press platform.
Data correspond to usage on the plateform after 2015. The current usage metrics is available 48-96 hours after online publication and is updated daily on week days.
Initial download of the metrics may take a while.