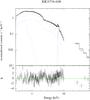
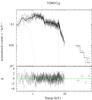
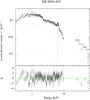
Fig. 9
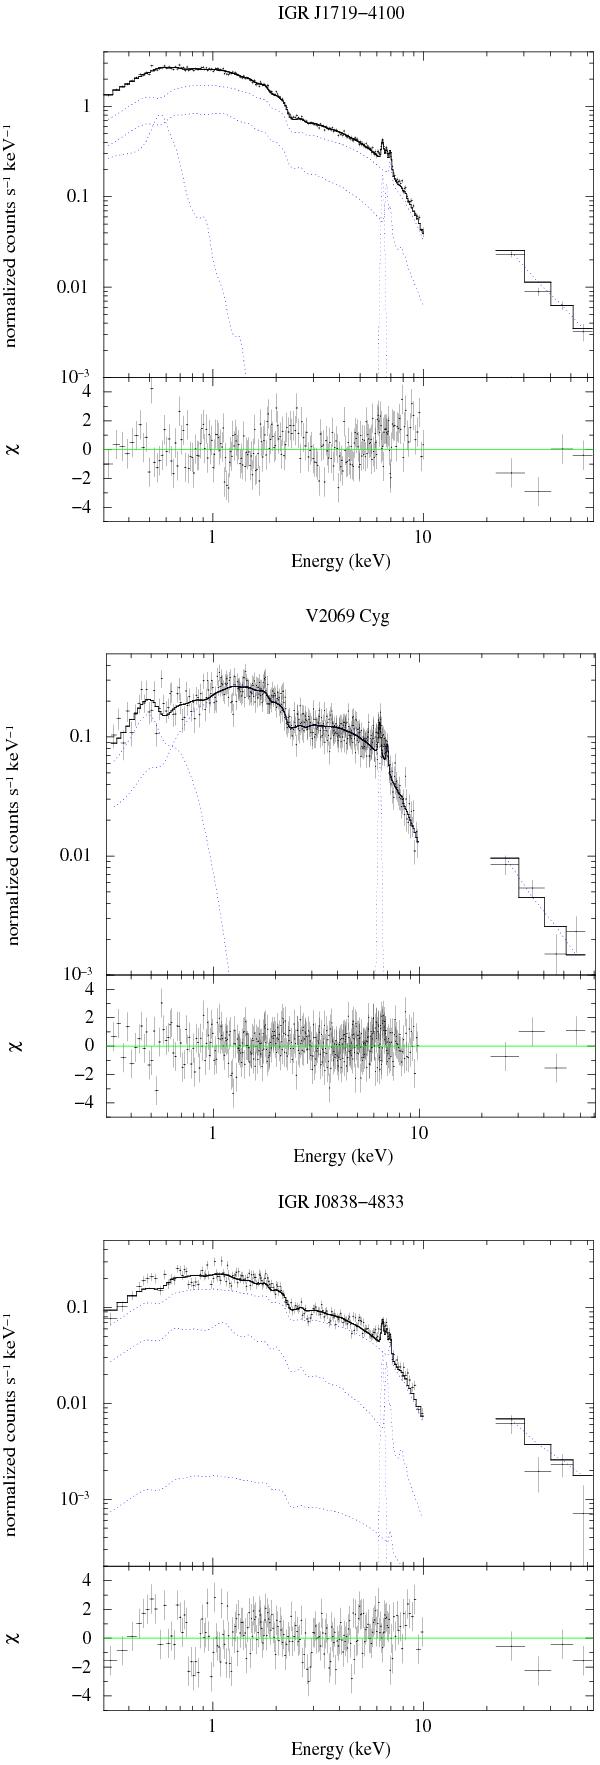
Broad-band unfolded spectra, with post fit residuals in the lower panels, for three representative cases. Spectra have been rebinned for plotting purpose. Composite model (solid black line), individual components (dotted blue lines). Up: IGR J1719. Wabs*Pcfabs*(3mekal+gauss) model used. Central: V2069 Cyg. Wabs*Pcfabs*(bbodyrad+mekal+gauss) model used. Bottom: IGR J0839. Wabs*Pcfabs*(3mekal+gauss) model used. An absorption feature at ~ 0.76 keV is present in the residuals (lower panel).
Current usage metrics show cumulative count of Article Views (full-text article views including HTML views, PDF and ePub downloads, according to the available data) and Abstracts Views on Vision4Press platform.
Data correspond to usage on the plateform after 2015. The current usage metrics is available 48-96 hours after online publication and is updated daily on week days.
Initial download of the metrics may take a while.