Free Access
Fig. 1
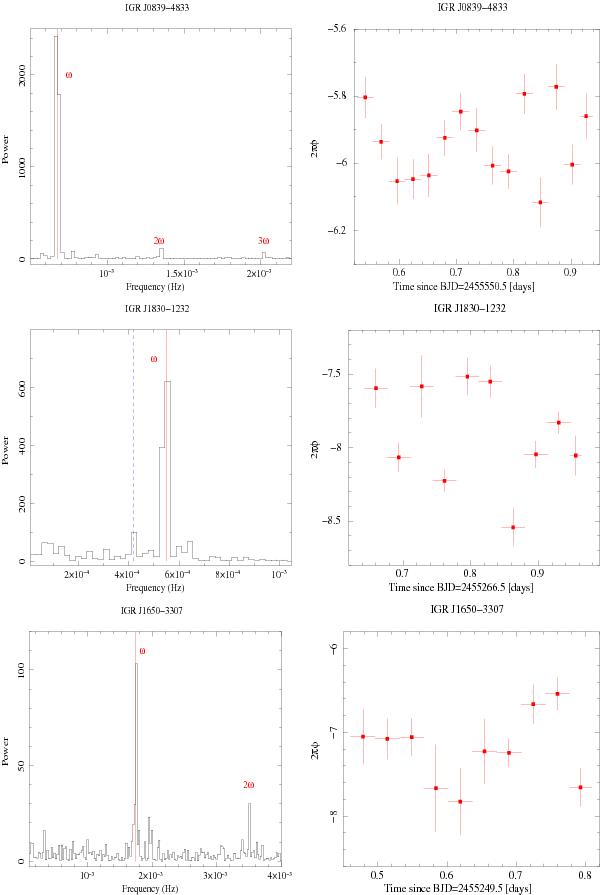
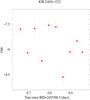
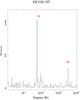
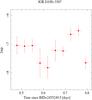
Left panel: power spectrum. Fundamental and harmonics are reported in red, while dotted blue lines represent sidebands. Right panel: evolution of the phase of the main signal, ω, versus time. For color version of all figures see the electronic edition of the paper.
This figure is made of several images, please see below:
Current usage metrics show cumulative count of Article Views (full-text article views including HTML views, PDF and ePub downloads, according to the available data) and Abstracts Views on Vision4Press platform.
Data correspond to usage on the plateform after 2015. The current usage metrics is available 48-96 hours after online publication and is updated daily on week days.
Initial download of the metrics may take a while.