Fig. 1
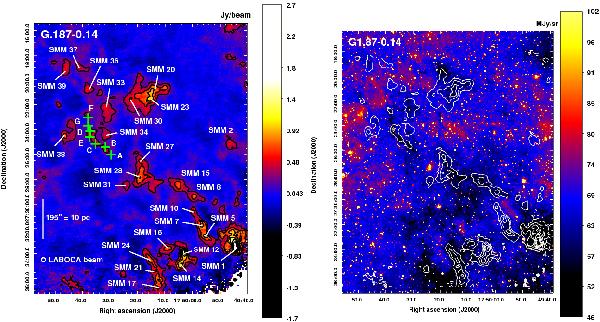
Left: LABOCA 870-μm map of G1.87-0.14. The image is shown with linear scaling, and the colour bar indicates the surface-brightness scale in Jy beam-1. The overlaid contours go from 0.27 Jy beam-1 (3σ) to 1.62 Jy beam-1, in steps of 3σ. Selected clumps are labelled with their designation (as listed in Table 3). The green plus signs indicate the positions of our C17O(2−1) observations (see Table 2). A scale bar indicating the 10 pc projected length is shown in the bottom left, with the assumption of a 10.57 kpc line-of-sight distance. The effective LABOCA beam of  is also shown in the lower left corner. Right: Spitzer 8-μm image towards G1.87-0.14 overlaid with LABOCA contours from the left panel. The image is shown with linear scaling, where the scale limits are based on the IRAF z-scale algorithm of the DS9 programme. The colour bar shows the surface-brightness scale in MJy sterad-1. Note that not all IR-dark regions are seen in submm emission.

Current usage metrics show cumulative count of Article Views (full-text article views including HTML views, PDF and ePub downloads, according to the available data) and Abstracts Views on Vision4Press platform.
Data correspond to usage on the plateform after 2015. The current usage metrics is available 48-96 hours after online publication and is updated daily on week days.
Initial download of the metrics may take a while.