Free Access
Fig. 6
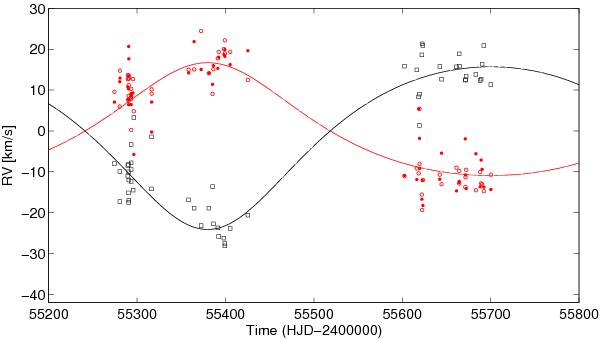
Radial velocity curves on the 640 day orbit. The black squares stand for the Ab lines in the spectrum, while the red circles represent the radial velocity residuals after subtraction of the eclipsing pair RV curve (filled for primary, open for secondary).
Current usage metrics show cumulative count of Article Views (full-text article views including HTML views, PDF and ePub downloads, according to the available data) and Abstracts Views on Vision4Press platform.
Data correspond to usage on the plateform after 2015. The current usage metrics is available 48-96 hours after online publication and is updated daily on week days.
Initial download of the metrics may take a while.