Fig. 8
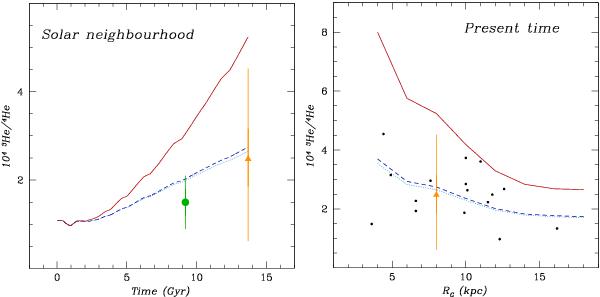
Temporal (left panel) and spatial (right panel) variation of helium isotopic ratio in the solar neighborhood and along the galactic disk at the present time, respectively. Models are the same as in Fig. 7. Data are from Geiss & Gloeckler (1998) for the PSC (green filled circle), Bania et al. (2002) for Galactic HII regions (black dots), and Gloeckler & Geiss (1996) for the LISM (orange filled trangle). 1-σ and 3-σ errors are also shown as thick and thin lines, respectively.
Current usage metrics show cumulative count of Article Views (full-text article views including HTML views, PDF and ePub downloads, according to the available data) and Abstracts Views on Vision4Press platform.
Data correspond to usage on the plateform after 2015. The current usage metrics is available 48-96 hours after online publication and is updated daily on week days.
Initial download of the metrics may take a while.