Fig. 7
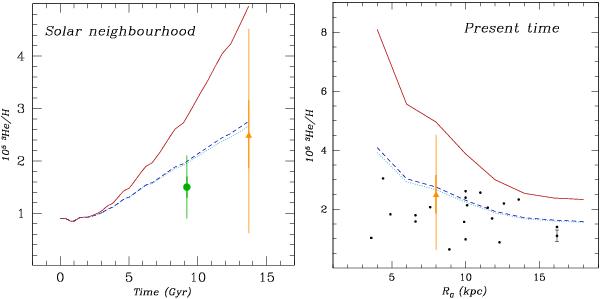
Left panel: evolution of 3He/H with time in the solar neighborhood. Data for the PSC (green filled circle) and local interstellar medium (LISM, orange filled triangle) are from Geiss & Gloeckler (1998) and Gloeckler & Geiss (1996), respectively. 1-σ and 3-σ error bars are shown with thick and thin lines, respectively. Right panel: radial distribution of 3He/H at the present time. The dots are HII regions data from Bania et al. (2002) (error bars are shown only for S209; see text for discussion). The triangle at RG = 8 kpc represents LISM data from Gloeckler & Geiss (1996). The predictions from Models A, B and C are shown in both panels by the red full, blue dashed and cyan dotted lines respectively.
Current usage metrics show cumulative count of Article Views (full-text article views including HTML views, PDF and ePub downloads, according to the available data) and Abstracts Views on Vision4Press platform.
Data correspond to usage on the plateform after 2015. The current usage metrics is available 48-96 hours after online publication and is updated daily on week days.
Initial download of the metrics may take a while.