Fig. 6
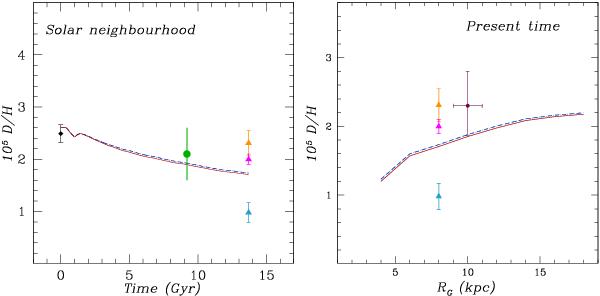
Evolution of D/H in the solar neighborhood (left panel) and distribution of D/H along the Galactic disc at the present time (right panel). The predictions of Models A and B are shown (red solid and dashed blue lines, respectively). At t = 0 Gyr, we plot the WMAP value (filled black diamond). The PSC data by Geiss & Gloeckler (1998) are shown (filled green circle). The local interstellar medium (LISM) data are from Linsky et al. (2006), Hébrard et al. (2005) and Prodanović et al. (2010) (filled orange, light blue, and magenta triangles, respectively). The data for the outer disc (RG = 10 kpc) are from Rogers et al. (2005, filled bordeaux circle).
Current usage metrics show cumulative count of Article Views (full-text article views including HTML views, PDF and ePub downloads, according to the available data) and Abstracts Views on Vision4Press platform.
Data correspond to usage on the plateform after 2015. The current usage metrics is available 48-96 hours after online publication and is updated daily on week days.
Initial download of the metrics may take a while.