Fig. 1
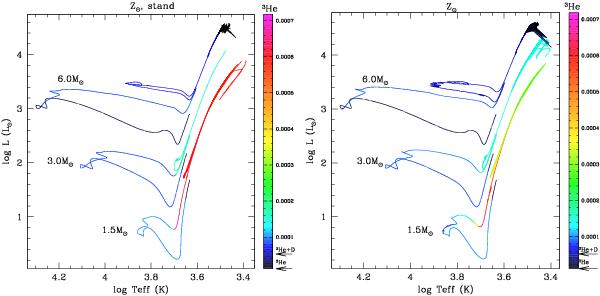
Theoretical evolutionary tracks in the HR diagram for the 1.5 M⊙, 3.0 M⊙, and 6.0 M⊙ models at solar metallicity following the standard prescription (left panel); and including rotation-induced mixing and thermohaline instability (right panel), from the pre-main sequence up to the end of the TP-AGB phase. Colours depict the mass fraction of 3He at the stellar surface as indicated on the right, with the arrows showing the initial 3He and 3He + 2H content assumed at birth.
Current usage metrics show cumulative count of Article Views (full-text article views including HTML views, PDF and ePub downloads, according to the available data) and Abstracts Views on Vision4Press platform.
Data correspond to usage on the plateform after 2015. The current usage metrics is available 48-96 hours after online publication and is updated daily on week days.
Initial download of the metrics may take a while.