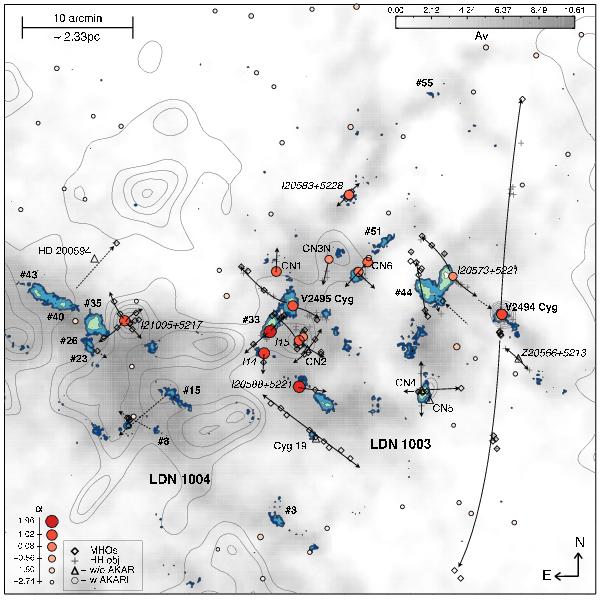
Fig. 5

An AV map of the surveyed region constructed from WFCAM J, H and K band data using the technique described in Rowles & Froebrich (2009). The overlaid grey-scaled contours are from IRAS HiRes 100 μm data; these increase from 10% of the local field maximum in steps of 10%. Filled contours represent the CSO 1.1 mm data with values of 40, 60, 100 and 180 mJy. The hashed numbers are the designated CSO core numbers from Aspin et al. (2011). Sources described and discussed in Sect. 4.2 are presented using the same symbols as in Fig. 9. The sources with the most positive values of α are marked with a larger and darker-coloured symbol; the objects with the most negative values of α are marked with a smaller and lighter-coloured symbol. The outflows listed in Table 1 are indicated with solid-line arrows; suspected flows are marked with dashed-line arrows.
Current usage metrics show cumulative count of Article Views (full-text article views including HTML views, PDF and ePub downloads, according to the available data) and Abstracts Views on Vision4Press platform.
Data correspond to usage on the plateform after 2015. The current usage metrics is available 48-96 hours after online publication and is updated daily on week days.
Initial download of the metrics may take a while.


