Fig. 3
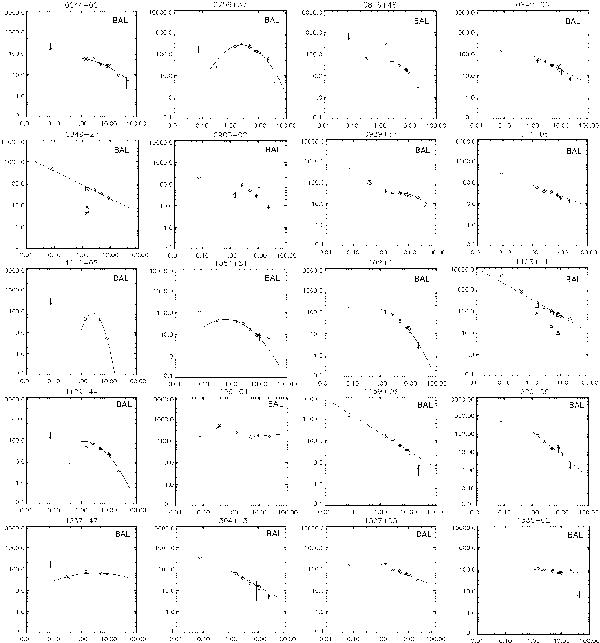
Radio spectra of the 25 BAL and 34 non-BAL QSOs (GHz on x-axis, mJy on y-axis). Error bars are shown when larger than the symbol size. Crosses represent flux densities from the literature, rhombi are flux densities from our observational campaign, and arrows are upper limits from the literature. Solid lines are fits to a parabola and dashed lines are fits to a power law. For resolved sources, flux densities are presented as follows: a square for C component (core) and triangle, asterisk, and dot for components A, B, and D, respectively (see Tables 5 and 6). For 1728+56, the flux densities at 4.8 and 8.4 GHz shown as asterisks correspond to the B+C components.
Current usage metrics show cumulative count of Article Views (full-text article views including HTML views, PDF and ePub downloads, according to the available data) and Abstracts Views on Vision4Press platform.
Data correspond to usage on the plateform after 2015. The current usage metrics is available 48-96 hours after online publication and is updated daily on week days.
Initial download of the metrics may take a while.