Fig. 12
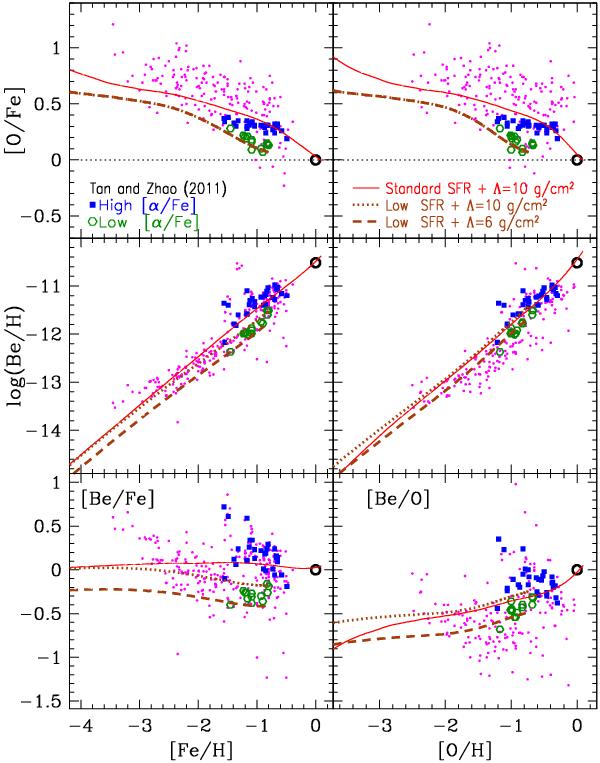
Same as Fig. 11, with two new data sets (thick symbols) for stars with high [α/Fe] (filled squares) and low [α/Fe] (open circles) from Tan & Zhao (2011); all other data of Fig. 11 are displayed as dots. The thin solid curves correspond to the “standard” model presented in Fig. 11, while the thick dotted curves to a model with reduced SF efficiency and the thick dashed curves to a model with reduced SF efficiency and reduced escape length Λ for GCR (see text).
Current usage metrics show cumulative count of Article Views (full-text article views including HTML views, PDF and ePub downloads, according to the available data) and Abstracts Views on Vision4Press platform.
Data correspond to usage on the plateform after 2015. The current usage metrics is available 48-96 hours after online publication and is updated daily on week days.
Initial download of the metrics may take a while.