Fig. 2
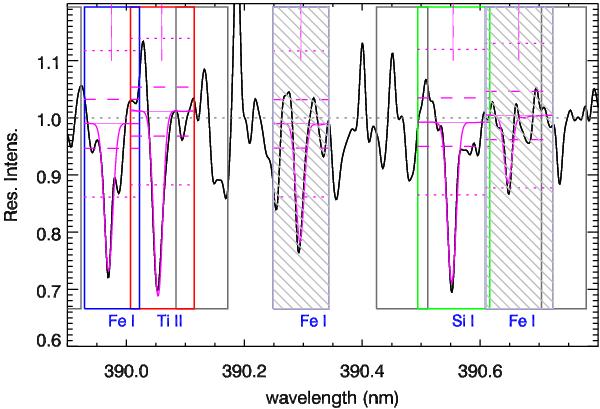
Portion of the spectrum of SDSS J122935+262445, one of the lowest S/N spectra in our sample. The boxes show the wavelength intervals used to fit the lines (blue for Fe i lines, green the Si i line, red the Ti ii line), when they are shaded it means that MyGIsFOS has rejected the line. Two boxes showing continuum regions are also shown (grey boxes). Horizontal dashed and dotted lines indicate the local 1σ and 3σ estimated noise ranges. Vertical magenta continuous and dashed lines (in the top part of the plot) indicate by how much every single line has been shifted in radial velocity by MyGIsFOS to achieve an optimal fit.
Current usage metrics show cumulative count of Article Views (full-text article views including HTML views, PDF and ePub downloads, according to the available data) and Abstracts Views on Vision4Press platform.
Data correspond to usage on the plateform after 2015. The current usage metrics is available 48-96 hours after online publication and is updated daily on week days.
Initial download of the metrics may take a while.