Fig. 2
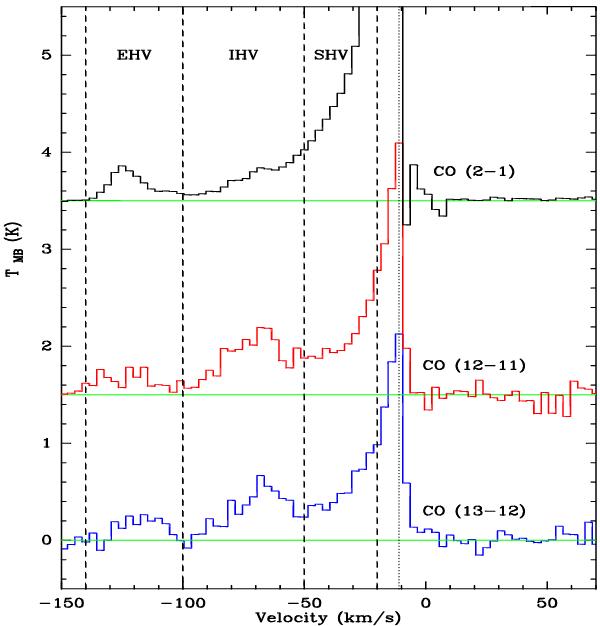
SOFIA/GREAT spectra of CO (12–11) and (13–12) in Cep E, together with the low-J CO (2–1) transition, taken at the position shown in Fig. 1. The CO (13–12) and (2–1) spectra are taken from data with a spatial resolution of 20′′, while the spatial resolution of the CO (12–11) is 21 7. The two upper spectra have been shifted along the Y-axis. The green horizontal lines show the zero level of each spectrum. The dashed vertical lines indicate the limits of each velocity range defined in Table 2. The dotted vertical line shows the systemic velocity ( − 11 km s-1). The spectral resolution is 3 km s-1 for all lines.
Current usage metrics show cumulative count of Article Views (full-text article views including HTML views, PDF and ePub downloads, according to the available data) and Abstracts Views on Vision4Press platform.
Data correspond to usage on the plateform after 2015. The current usage metrics is available 48-96 hours after online publication and is updated daily on week days.
Initial download of the metrics may take a while.