| Issue |
A&A
Volume 542, June 2012
|
|
|---|---|---|
| Article Number | A44 | |
| Number of page(s) | 5 | |
| Section | Galactic structure, stellar clusters and populations | |
| DOI | https://doi.org/10.1051/0004-6361/201218928 | |
| Published online | 04 June 2012 | |
No evidence for a central IMBH in M 15
1 Argelander Institut für Astronomie (AIfA), University of Bonn, Auf dem Hügel 71, 53121 Bonn, Germany
e-mail: This email address is being protected from spambots. You need JavaScript enabled to view it.
2 Max Planck Institut für Radioastronomie (MPIfR), Auf dem Hügel 69, 53121 Bonn, Germany
3 Department of Earth and Space Sciences, Chalmers University of Technology, Onsala Space Observatory, 439 92 Onsala, Sweden
Received: 31 January 2012
Accepted: 13 April 2012
Abstract
Intermediate mass black holes (IMBHs) with expected masses M• ≈ 104 M⊙ are thought to bridge the gap between stellar mass black holes (M• ≈ 3 − 100 M⊙) and supermassive black holes found at the centre of galaxies (M• > 106 M⊙). Until today, no IMBH has been confirmed observationally. The most promising objects to host an IMBH as their central mass are globular clusters. Here, we present high sensitivity multi-epoch 1.6 GHz very long baseline interferometry observations of the globular cluster M 15 that has been suggested to host an IMBH. Assuming the IMBH to be accreting matter from its surrounding we expect to detect it as a point source moving with the global motion of the cluster. However, we do not detect any such object within a radius of 6000 AU of the cluster centre in any of the five observations spread over more than one year. This rules out any variability of the putative IMBH on the time scale of one to two months. To get the most stringent upper limit for the flux density of the putative IMBH we concatenate the data of all five epochs. In this data we measure a 3σ upper flux limit of 10 μJy for a central source. We employ the fundamental plane of black hole activity to estimate the mass of the central IMBH candidate. Based on previous X-ray observations of M 15 our measurements indicate a 3σ upper mass limit of ≈ 500 M⊙.
Key words: globular clusters: individual: M 15 (NGC 7078) / black hole physics / techniques: interferometric / radio continuum: general
© ESO, 2012
1. Introduction
Super-massive black holes (SMBHs) with masses M• ≈ 106 − 9 solar masses (M⊙) are known to exist at the centre of galaxies (Kormendy & Richstone 1995). At the same time, observations of high-mass X-ray binaries led to the conclusion that stellar-mass black holes with M• ≈ 100 M⊙ must form as well (McClintock & Remillard 2006; Özel et al. 2010; Belczynski et al. 2010). The existence of black holes (BHs) bridging the gap between these two extremes in mass, the so-called intermediate mass black holes (IMBHs, M• ≈ 104 M⊙), is still under debate.
One possible candidate for IMBHs are ultraluminous X-ray sources (ULX, Colbert & Mushotzky1999) appearing to accrete matter at super-eddington rates. The interpretation of ULX-properties as being characteristic for IMBHs, however, is still in discussion (e.g. Berghea et al. 2008; Zampieri & Roberts 2009). Nevertheless, the recent discovery of the hyper-luminous X-ray source ESO 243-49 HLX-1 by Farrell et al. (2009) adds evidence that ULXs might host IMBHs.
Based on the black hole mass-stellar velocity dispersion relation (M• − σ) established for galaxies (Ferrarese & Merritt 2000; Gebhardt et al. 2000), an object like an IMBH can be expected to reside at the core of globular clusters (GCs). Even though recent work by Vesperini et al. (2010) shows that an IMBH can be formed in a GC environment, no conclusive observational evidence for the existence of IMBHs has been found to date.
Apart from, e.g, the globular clusters ω Cen (van der Marel & Anderson 2010), G1 in M 31 (Gebhardt et al. 2002; Ulvestad et al. 2007), and 47 Tuc (Lu & Kong 2011), M 15 has been one of the most promising GC-candidates to host an IMBH for a long time. Stellar surface density profiles of M 15 reveal a steady increase towards the center of the cluster indicating a state of advanced core-collapse (Djorgovski & King 1986). To explain the central brightness peak Newell et al. (1976) suggested an 800 M⊙ black hole to reside at the core of the cluster. The increase of the stellar velocity dispersion towards the centre of M 15 as measured by, e.g, Gerssen et al. (2003), supports the notion of a high central mass concentration in the cluster. In fact, dynamical models based on line-of-sight velocities and proper motions infer a mass of 3400 M⊙ within the central 1 arcsec (=0.05 pc at the distance of 10.3 ± 0.4 kpc, van den Bosch et al. 2006). The nature of this mass concentration is unknown. Gerssen et al. (2003) invoke the existence of an IMBH with a mass of  M⊙ to explain their observations. Similarly to Illingworth & King (1977), Baumgardt et al. (2003) and McNamara et al. (2003) challenge this interpretation, based on N-body simulations excluding an IMBH. Instead, these authors claim that the observational data can be explained equally well by assuming a collection of neutron stars to exist at the core of M 15. The latest simulations of that kind require a total of 1600 neutron stars to fit the velocity-dispersion profile mentioned above (Murphy et al. 2011).
Complementary to the indirect (non-)evidence using kinematic studies based on optical observations, X-ray and radio observations aim at directly detecting such an object. The fundamental plane of black hole activity (FP) as determined for active galactic nuclei (AGN) (Merloni et al. 2003; Falcke et al. 2004), relates black-hole mass, X-ray and radio luminosity. Now, assuming the same physical processes powering AGN-emission to also be characteristic for IMBHs, Maccarone (2004) predict a black hole mass of 400 M⊙ for the IMBH in M 15. Their result is based on an estimate of the cluster’s total mass, MGC, from its absolute V-magnitude, MV, and on a model by Miller & Hamilton (2002) stating that M• ≈ 10-3 MGC. Bash et al. (2008), on the other hand, perform a survey of M 15 at 8.6 GHz using the Very Large Array that reaches a noise level of 8.5 μJy/Beam. Using the FP they predict a flux density of 103 − 105 μJy for a putative IMBH with a spectral index α = −0.7. They detect no central source at a 3σ upper flux limit of 25 μJy. Similary, Cseh et al. (2010) tried to detect an IMBH at the center of the globular cluster NGC 6388. The 3σ noise level (81 μJy) of their observations with the Australia Telescope Compact Array allowed the authors to constrain the mass of the possible IMBH to be lower than ≈ 1500 M⊙.
In this paper we discuss multi-epoch observations of M 15 almost three times as sensitive as those of Bash et al. (2008). The high angular resolution of our data allows us to disentangle any possible background sources from objects belonging to the cluster. Furthermore, the long time line spanning 15 months allows us to, in principle, detect the proper motion of a possible central radio source moving with the global motion of the cluster expected to be on the order of −1.0 ± 0.4 and −3.6 ± 0.8 mas/yr in right ascension (RA) and declination (Dec), respectively (Jacoby et al. 2006).
2. Observations
We observed M 15 five times in a global VLBI campaign that was spread over a time period of more than one year. The observations included in this analysis were conducted on 11 November 2009, 7 March 2010, 5 June 2010, 2 November 2010, and 27 February 2011. The array we employed consisted of eight European VLBI Network (EVN) antennas (Jodrell Bank, Onsala, Westerbork, Effelsberg, Noto, Medicina, Toruń, Arecibo) and the Greenbank Telescope (GBT). We observed at a central frequency of 1.6 GHz and the data was recorded at 1024 Mbps. Accounting for the different receiver systems at the individual telescopes our total bandwidth amounts to 230 MHz on average. The correlation was done at the EVN-MkIV correlator (Schilizzi et al. 2001) at the Joint Institute for VLBI in Europe (JIVE).
The longest baselines in east-west (north-south) direction extending over 7500 (2000) km allow for a resolution of 2.2 × 6.3 mas. The largest dishes of the array (Arecibo, Effelsberg, and the GBT) ensure a maximum sensitivity of approximately 4 μJy/Beam.
The observing schedule lasted six hours in total, 3.6 h of which were spent on the target cluster M 15. The quasar J2139+1423 (located ≈ 3.17° to the north-east of the pointing center) served as phase calibrator and the blazar 3C 454.3 was used for bandpass calibration. Arecibo-data is available for 75 (50) min in epochs 1 and 5 (epoch 3). Unfortunately, epochs 2 and 4 lack any Arecibo data which is why the sensitivity and astrometric precision of these two datasets is lower by about a factor of two.
Aiming to detect compact radio sources close to the core of M 15 we map out the entire central region within 2′ in only one pointing. For this project, however, only the very central region (the central 16′′) correlated at RA = 212958 3120, Dec = 12°10′02
 679 (J2000 equinox) is of interest. The entire dataset will be described in a forthcoming paper.
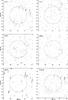 |
Fig. 1 Contour plots of all five individual observations and the composite image combining the data of all epochs. The tiles are centred on the assumed core of M 15 at coordinates RA = 212958 |
3. Data reduction
After correlation, all data is reduced, calibrated and imaged using the NRAO Astronomical Image Processing System (AIPS1). A priory calibration tables including system temperature and gain curve corrections as well as a flag table containing information about band edges and off-source times are provided by the EVN pipeline2. We apply these to the dataset as given. Parallactic angle corrections are determined with the AIPS task CLCOR and first ionospheric corrections are computed running TECOR with the total electron content (TEC) maps published by the Center for Orbit Determination in Europe3. Even though these maps are quite crude in angular resolution (about 5° × 2.5°) they have shown to be of use reducing the scatter in phase delay by a factor of 2–5 (Walker & Chatterjee 1999). Next, we identify and flag radio frequency interference (RFI) for all antennas and sub bands.
The bandpass calibration is done running BPASS on the data for 3C 454.3 and yields phase and amplitude gain factors for all 8 × 128 (512, epoch 1) channels for all antennas. We align phases in between IFs by performing a manual fringe correction running FRING on 3C 454.3 on a sub-interval of about 30 s of observation.
At this point, we combine all correction tables obtained so far and apply it to the data of the phase calibrator. We fringe fit this dataset including data over the entire time range. We solve for phase delays and phase rates simultaneously using solution intervals of 1.5 min.
The fringe solutions in conjunction with all calibration solutions found earlier are then applied to the M 15 data. In order to eliminate any residual phase delays and amplitude errors caused by the atmosphere and the ionosphere we take advantage of the strong unclassified source S1 (Johnston et al. 1991) located about 94″ to the west of the cluster centre and use it for in-beam calibration. To speed up the self-calibration process we average the visibilities both in the time- and frequency domain to 2 s integration time and 64 channels per IF.
Finally, we image the self-calibrated data running IMAGR employing natural weighting to ensure maximal sensitivity. In order to account for possible inaccuracies in the assumed cluster centre we produce an image that has an angular size of roughly 16″ × 16″ (=0.8 × 0.8 pc).
4. Analysis and results
In all five epochs we first produce a noise map of the image by smoothing it with a kernel that has a size of 1024 × 1024 pixels. Based on this rms map, the AIPS source detection algorithm SAD then searches for objects down to a signal-to-noise ratio of 3. The coordinates of the possible sources detected in this fashion in all five observation epochs are then cross-correlated. Cross-correlation is performed allowing for a maximal positional shift of 15 mas in between epochs. This corresponds to roughly four times the maximal beam width in right ascension. No match can be found relating all five data sets.
Finally, we also inspect the images manually. Figure 1 displays contour plots of the dirty images of the central region of M 15 for all five epochs. All tiles are centred on the cluster core as published by Goldsbury et al. (2010) at coordinates RA = 212958330, Dec = 12°10′01200 (accurate to within 0.2′′). We do not detect a significant signal in any of the epochs. Accounting for the different sensitivity limits varying between 4.3 μJy/Beam in epoch 3 and 11.5 μJy/Beam in epoch 4, we can put upper 3σ limits between 13 and 35 μJy/Beam on the flux density of a possible central object. Figure 1 also displays a dirty image of the data concatenated over all five epochs. The rms of this deconvolved image is 3.3 μJy/Beam which translates to a 3σ upper flux limit of 10 μJy/Beam.
5. Discussion
5.1. Radio flux limits and variability
The five individual epochs have rather different sensitivity limits that correspond to a 3σ upper flux density limit of 14.1, 26.7, 12.9, 34.5, 17.4 μJy/beam for epochs 1 to 5. We did not detect a central source in any of the observations that were conducted at regular intervals of about three months spanning a time range of 15 months. Provided the IMBH-candiate is of transient nature that is in its “on”-state for longer than one or two months, the probability to have missed it in all five observations is negligible. Therefore, we rule out any variability of the central object on these time scales. Accordingly, we can assume a steady state emission model in which case the noise level of the concatenated data yields the most stringent 3σ upper flux limit of ≈ 10 μJy. This flux limit is a factor of 2.5 lower than that from Bash et al. (2008) and we will adopt it throughout the following analysis.
5.2. Mass limits from X-ray observations
Similarly to the first versions of the FP from Merloni et al. (2003) and Falcke et al. (2004), the FP derived by Körding et al. (2006) uses a sample including both X-ray binaries (XRBs) and AGN. Thus, both versions span several orders of magnitude in BH mass and should also be applicable for the intermediate mass range of IMBHs. The relation found by Körding et al. (2006) for XRBs and low-luminosity radiatively inefficient AGN has the lowest intrinsic scatter σint = 0.12 dex ( ≈ 30 percent) and we will use it in the following. In terms of black hole mass M•, radio luminosity LR, and X-ray luminosity LX their FP-relation reads
 M 15 is known to host two strong X-ray sources, AC211 (Giacconi et al. 1974; Clark et al. 1975) and M 15 X2 (White & Angelini 2001), close to the core of the cluster. Both have been classified as low mass XRBs. The strong X-ray emission of these two objects makes it difficult to detect the expectedly faint emission of a central IMBH. Nevertheless, Ho et al. (2003) put an upper limit of LX = 5.6 × 1032 erg s-1 on the X-ray luminosity of the putative IMBH. Hannikainen et al. (2005) manage to detect a faint source (LX = 3.3 × 1032 erg s-1) close to core of M 15 which they attribute to a dwarf nova. In their paper, Hannikainen et al. (2005) report a flux detection limit of 2 × 10-15 erg s-1/cm (0.5–2 keV) which translates to an X-ray luminosity of 2.54 × 1031 erg s-1 at the distance of M 15. Converting our measured radio flux to a 5 GHz radio luminosity LR ≤ 6.34 × 1027 erg s-1 (assuming a flat radio spectrum) and inserting it together with the upper limit for the X-ray luminosity from Hannikainen et al. (2005) the FP yields a mass limit of 232 ± 93 M⊙. This translates to a very conservative 3σ upper mass limit of 511 M⊙ for the putative IMBH. Our observations thus decreased the upper mass limit by a factor of four compared to that indicated by earlier observations by Bash et al. (2008).
5.3. Mass limits from accretion models
The lack of a central X-ray source in M 15 is expected because the accretion process is most likely radiatively inefficient (Ho et al. 2003). To constrain the mass of the IMBH-candidate we estimate the X-ray luminosity based on the (unknown) accretion rate Ṁ: 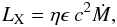 where η and ϵ are the radiation efficiency and the accretion efficiency, respectively. The accretion process of radiatively inefficient black hole binaries (e.g. Esin et al. 1997) as well as those of quiescent SMBHs (e.g. Yuan et al. 2003) is well described by advection-dominated accretion flow models (ADAF, Narayan & Yi 1994). Such BHs undergo quasi-spherical accretion and, thus, following Maccarone (2004) we further assume that mass accretion of the putative IMBH in M 15 can be described by the Bondi-Hoyle-Lyttleton (BHL) formalism (Hoyle & Lyttleton 1941; Bondi & Hoyle 1944; Ho et al. 2003)
 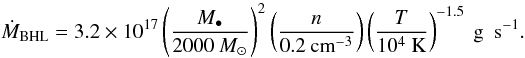 Here, n and T are the gas density and temperature in the GC, respectively. We adopt n = 0.2 cm-3 from Freire et al. (2001) and use a typical GC gas temperature of T = 104 K. Inserting the above equations into the FP, and solving for M• yields
  Mass estimates from this relation depend crucially on the choice of η and ϵ. Observations of the IMBH-candiate in G1 in M 31 suggest that the radiative efficiency η < 0.01 for this source (Ulvestad et al. 2007). This is consistent with the aforementioned ADAF models that are only valid for η ≪ 0.1 (Narayan & McClintock 2008). In order to cover as large a parameter space as possible we choose η = 0.1 as conservative upper limit for the radiative efficiency. As lower limit we take the estimate of Ho et al. (2003) who state that η can be as low as 10-4 for the IMBH candidate in M 15. It is not clear at all at what fraction ϵ of the Bondi-rate the central source is accreting. Typical values are in the range ϵ = [10-3,0.1 ] (Maccarone 2004; Ulvestad et al. 2007; Cseh et al. 2010) which we adopt for our analysis. Consequently, we explore a parameter space covering η ∗ ϵ = [0.01,10-7 ] . Based on the upper X-ray luminosity as measured by Hannikainen et al. (2005) we can exclude values of η ∗ ϵ ≥ 10-3 because they would yield stronger X-ray emission than what is observed. The mass limit for a value of η ∗ ϵ = 10-4 is indicated in Fig. 2 and would yield a black hole mass M• = 94 ± 37 M⊙. For η ∗ ϵ = 10-5 we find M• = 202 ± 80 M⊙ which would indicate a source that is accreting at ten percent of the Bondi rate with a radiative efficiency4η = 10-4. The combination of both, very inefficient radiation (η = 10-4) and inefficient accretion (ϵ = 10-3) is also indicated in Fig. 2 with the mass estimate of M• = 927 ± 371 M⊙.
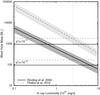 |
Fig. 2 Black hole mass as a function of X-ray luminosity for our measured radio luminosity (LR = 6.34 × 1027 erg s-1) as predicted by the FP from Körding et al. (2006) (solid lines) and Plotkin et al. (2012) (dashed lines). The gray shaded areas indicate the 1σ uncertainties of the relations. The horizontal lines mark the predicted masses for different assumptions on the radiative efficiency η and the accretion efficiency ϵ. The vertical dotted line marks the upper limit for the X-ray luminosity from Hannikainen et al. (2005). |
5.4. Mass estimates from other FP-relations
Mass estimates computed here with the FP-relation from Körding et al. (2006) agree well within the errors with those estimates computed from the relations found by, e.g., Merloni et al. (2003) and Gültekin et al. (2009). We note, however, a significant offset towards higher masses when using the latest version of the FP published by Plotkin et al. (2012). Their relation reads
 In Fig. 2 the predicted BH mass from this relation for our measured radio flux density is indicated by the dashed lines. With this relation the limit for the X-ray luminosity results in a BH mass M• = 1654 ± 661 M⊙. However, this mass limit can only be explained by the least efficient accretion limit of η ∗ ϵ = 10-7. All higher values of η ∗ ϵ would yield an X-ray luminosity beyond the one observed and can be excluded within this FP-relation.
6. Conclusions
Using our multi-epoch high sensitivity observations of M 15 we were able to put an upper limit of 10 μJy on the 1.6 GHz radio flux density of a central source in this globular cluster. Assuming that the central mass concentration is a black hole we employed the FP as derived by Körding et al. (2006) to put constraints on the mass of the source. The lack of a detection of an object in the X-ray observations coinciding with the assumed cluster center allowed us to use an upper limit for the X-ray luminosity of the putative IMBH which yields a black hole mass M• = 232 ± 93 M⊙. Such a mass estimate is in agreement with a source accreting matter from its surrounding at up to ten percent of the Bondi-rate with a radiative efficiency as low as 10-4 which is consistent with results for the IMBH-candidate in G1 in M 31 (Ulvestad et al. 2007). Even the 3σ upper limit of ≈500 M⊙, however, is still a factor of seven lower than that required to explain the dynamics of the cluster (van den Bosch et al. 2006). If we employ the FP from Plotkin et al. (2012) the 3σ upper mass limit is increased to ≈ 3600 M⊙ which would agree with the required dynamical mass. However, such a mass can only be explained if the central object is accreting at 0.1 percent of the Bondi rate and if only 0.01 percent of radiation is escaping from the accretion region. Furthermore, this mass estimate disagrees by a factor of seven with results obtained from most other FP-relations and we adopt the mass limit of M• = 232 ± 93 M⊙.
Therefore, we conclude that M 15 most likely does not contain an IMBH but that its central region probably hosts a collection of dark remants such as neutron stars as proposed by, e.g., Baumgardt et al. (2003); McNamara et al. (2003), and Murphy et al. (2011) instead. The reason for not detecting these pulsars is most probably their expected low flux density of ≈ 2 μJy (Sun et al. 2002).
During the final stages of the refereeing process of this paper, Strader et al. (2012) published a mass estimate for the IMBH in M 15 that is in good agreement with the estimate derived here.
ftp://ftp.unibe.ch/aiub/CODE/
Obviously, other combinations of (η,ϵ) would also be suitable but we give this one as a limiting case that has been discussed by other authors (e.g. Ho et al. 2003; Cseh et al. 2010).
Acknowledgments
The authors would like to thank the JIVE staff for correlating and for support with scheduling the complex observations. We would also like to thank the anonymous referee for productive criticism. F.K. acknowledges partial support through the Bonn-Cologne Graduate School of Physics and Astronomy. This research is supported by the European Community Framework Programme 7, Advanced Radio Astronomy in Europe, grant agreement No. 227290.
References
- Bash, F. N., Gebhardt, K., Goss, W. M., & Van den Bout, P. A. 2008, AJ, 135, 182 [NASA ADS] [CrossRef] [Google Scholar]
- Baumgardt, H., Hut, P., Makino, J., McMillan, S., & Portegies Zwart, S. 2003, ApJ, 582, L21 [NASA ADS] [CrossRef] [Google Scholar]
- Belczynski, K., Bulik, T., Fryer, C. L., et al. 2010, ApJ, 714, 1217 [NASA ADS] [CrossRef] [Google Scholar]
- Berghea, C. T., Weaver, K. A., Colbert, E. J. M., & Roberts, T. P. 2008, ApJ, 687, 471 [NASA ADS] [CrossRef] [Google Scholar]
- Bondi, H., & Hoyle, F. 1944, MNRAS, 104, 273 [NASA ADS] [CrossRef] [Google Scholar]
- Clark, G. W., Markert, T. H., & Li, F. K. 1975, ApJ, 199, L93 [NASA ADS] [CrossRef] [Google Scholar]
- Colbert, E. J. M., & Mushotzky, R. F. 1999, ApJ, 519, 89 [NASA ADS] [CrossRef] [Google Scholar]
- Cseh, D., Kaaret, P., Corbel, S., et al. 2010, MNRAS, 406, 1049 [NASA ADS] [Google Scholar]
- Djorgovski, S., & King, I. R. 1986, ApJ, 305, L61 [NASA ADS] [CrossRef] [Google Scholar]
- Esin, A. A., McClintock, J. E., & Narayan, R. 1997, ApJ, 489, 865 [NASA ADS] [CrossRef] [Google Scholar]
- Falcke, H., Körding, E., & Markoff, S. 2004, A&A, 414, 895 [NASA ADS] [CrossRef] [EDP Sciences] [Google Scholar]
- Farrell, S. A., Webb, N. A., Barret, D., Godet, O., & Rodrigues, J. M. 2009, Nature, 460, 73 [NASA ADS] [CrossRef] [PubMed] [Google Scholar]
- Ferrarese, L., & Merritt, D. 2000, ApJ, 539, L9 [NASA ADS] [CrossRef] [Google Scholar]
- Freire, P. C., Kramer, M., Lyne, A. G., et al. 2001, ApJ, 557, L105 [NASA ADS] [CrossRef] [Google Scholar]
- Gebhardt, K., Bender, R., Bower, G., et al. 2000, ApJ, 539, L13 [NASA ADS] [CrossRef] [Google Scholar]
- Gebhardt, K., Rich, R. M., & Ho, L. C. 2002, ApJ, 578, L41 [NASA ADS] [CrossRef] [Google Scholar]
- Gerssen, J., van der Marel, R. P., Gebhardt, K., et al. 2003, AJ, 125, 376 [NASA ADS] [CrossRef] [Google Scholar]
- Giacconi, R., Murray, S., Gursky, H., et al. 1974, ApJS, 27, 37 [NASA ADS] [CrossRef] [Google Scholar]
- Goldsbury, R., Richer, H. B., Anderson, J., et al. 2010, AJ, 140, 1830 [NASA ADS] [CrossRef] [Google Scholar]
- Gültekin, K., Cackett, E. M., Miller, J. M., et al. 2009, ApJ, 706, 404 [NASA ADS] [CrossRef] [Google Scholar]
- Hannikainen, D. C., Charles, P. A., van Zyl, L., et al. 2005, MNRAS, 357, 325 [NASA ADS] [CrossRef] [Google Scholar]
- Ho, L. C., Terashima, Y., & Okajima, T. 2003, ApJ, 587, L35 [NASA ADS] [CrossRef] [Google Scholar]
- Hoyle, F., & Lyttleton, R. A. 1941, MNRAS, 101, 227 [NASA ADS] [Google Scholar]
- Illingworth, G., & King, I. R. 1977, ApJ, 218, L109 [NASA ADS] [CrossRef] [Google Scholar]
- Jacoby, B. A., Cameron, P. B., Jenet, F. A., et al. 2006, ApJ, 644, L113 [NASA ADS] [CrossRef] [Google Scholar]
- Johnston, H. M., Kulkarni, S. R., & Goss, W. M. 1991, ApJ, 382, L89 [NASA ADS] [CrossRef] [Google Scholar]
- Körding, E., Falcke, H., & Corbel, S. 2006, A&A, 456, 439 [NASA ADS] [CrossRef] [EDP Sciences] [Google Scholar]
- Kormendy, J., & Richstone, D. 1995, ARA&A, 33, 581 [NASA ADS] [CrossRef] [Google Scholar]
- Lu, T.-N., & Kong, A. K. H. 2011, ApJ, 729, L25 [NASA ADS] [CrossRef] [Google Scholar]
- Maccarone, T. J. 2004, MNRAS, 351, 1049 [NASA ADS] [CrossRef] [Google Scholar]
- McClintock, J. E., & Remillard, R. A. 2006, Black hole binaries, Compact stellar X-ray sources, ed. W. H. G. Lewin, & M. van der Klis (Cambridge University Press), 157 [Google Scholar]
- McNamara, B. J., Harrison, T. E., & Anderson, J. 2003, ApJ, 595, 187 [NASA ADS] [CrossRef] [Google Scholar]
- Merloni, A., Heinz, S., & di Matteo, T. 2003, MNRAS, 345, 1057 [NASA ADS] [CrossRef] [Google Scholar]
- Miller, M. C., & Hamilton, D. P. 2002, MNRAS, 330, 232 [NASA ADS] [CrossRef] [Google Scholar]
- Murphy, B. W., Cohn, H. N., & Lugger, P. M. 2011, ApJ, 732, 67 [NASA ADS] [CrossRef] [Google Scholar]
- Narayan, R., & McClintock, J. E. 2008, New A Rev., 51, 733 [NASA ADS] [CrossRef] [Google Scholar]
- Narayan, R., & Yi, I. 1994, ApJ, 428, L13 [NASA ADS] [CrossRef] [Google Scholar]
- Newell, B., Da Costa, G. S., & Norris, J. 1976, ApJ, 208, L55 [NASA ADS] [CrossRef] [Google Scholar]
- Özel, F., Psaltis, D., Narayan, R., & McClintock, J. E. 2010, ApJ, 725, 1918 [NASA ADS] [CrossRef] [Google Scholar]
- Plotkin, R. M., Markoff, S., Kelly, B. C., Körding, E., & Anderson, S. F. 2012, MNRAS, 419, 267 [NASA ADS] [CrossRef] [Google Scholar]
- Schilizzi, R. T., Aldrich, W., Anderson, B., et al. 2001, Exper. Astron., 12, 49 [Google Scholar]
- Strader, J., Chomiuk, L., Maccarone, T., et al. 2012, ApJ, 750, L27 [NASA ADS] [CrossRef] [Google Scholar]
- Sun, X.-H., Han, J.-L., & Qiao, G.-J. 2002, Chinese J. Astron. Astrophys., 2, 133 [Google Scholar]
- Ulvestad, J. S., Greene, J. E., & Ho, L. C. 2007, ApJ, 661, L151 [NASA ADS] [CrossRef] [Google Scholar]
- van den Bosch, R., de Zeeuw, T., Gebhardt, K., Noyola, E., & van de Ven, G. 2006, ApJ, 641, 852 [NASA ADS] [CrossRef] [Google Scholar]
- van der Marel, R. P., & Anderson, J. 2010, ApJ, 710, 1063 [NASA ADS] [CrossRef] [Google Scholar]
- Vesperini, E., McMillan, S. L. W., D’Ercole, A., & D’Antona, F. 2010, ApJ, 713, L41 [NASA ADS] [CrossRef] [Google Scholar]
- Walker, R. C., & Chatterjee, S. 1999, VLBA Scientific Memo 23 (Socorro, NM: NRAO), http://www.vlba.nrao.edu/memos/sci/ [Google Scholar]
- White, N. E., & Angelini, L. 2001, ApJ, 561, L101 [NASA ADS] [CrossRef] [Google Scholar]
- Yuan, F., Quataert, E., & Narayan, R. 2003, ApJ, 598, 301 [NASA ADS] [CrossRef] [Google Scholar]
- Zampieri, L., & Roberts, T. P. 2009, MNRAS, 400, 677 [NASA ADS] [CrossRef] [Google Scholar]
All Figures
|
Fig. 1 Contour plots of all five individual observations and the composite image combining the data of all epochs. The tiles are centred on the assumed core of M 15 at coordinates RA = 212958 |
| In the text | |
|
Fig. 2 Black hole mass as a function of X-ray luminosity for our measured radio luminosity (LR = 6.34 × 1027 erg s-1) as predicted by the FP from Körding et al. (2006) (solid lines) and Plotkin et al. (2012) (dashed lines). The gray shaded areas indicate the 1σ uncertainties of the relations. The horizontal lines mark the predicted masses for different assumptions on the radiative efficiency η and the accretion efficiency ϵ. The vertical dotted line marks the upper limit for the X-ray luminosity from Hannikainen et al. (2005). |
| In the text | |
Current usage metrics show cumulative count of Article Views (full-text article views including HTML views, PDF and ePub downloads, according to the available data) and Abstracts Views on Vision4Press platform.
Data correspond to usage on the plateform after 2015. The current usage metrics is available 48-96 hours after online publication and is updated daily on week days.
Initial download of the metrics may take a while.