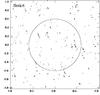
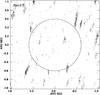
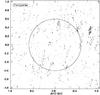
Fig. 1
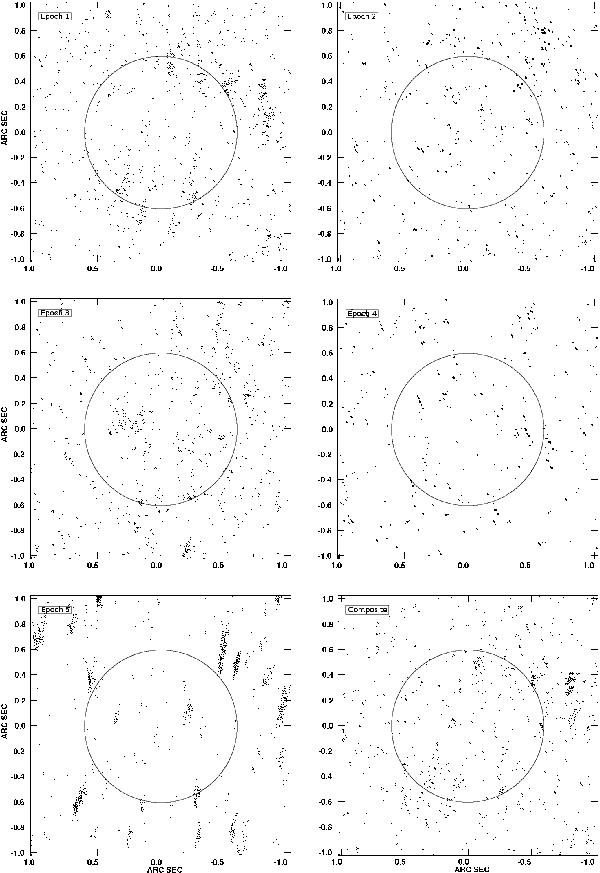
Contour plots of all five individual observations and the composite image combining the data of all epochs. The tiles are centred on the assumed core of M 15 at coordinates RA = 212958 330, Dec = 12°10′01
 200. The circle indicates the 3σ error of the position of the core as determined by Goldsbury et al. (2010). Adopting a distance of 10.3 kpc to M 15, each tile has a physical dimension of about (20 000 AU)2. Contours are ( − 5, − 3,3,5) times the rms in each individual epoch (4.7, 8.9, 4.3, 11.5, 5.8 μJy). The noise level of the composite image is 3.3 μJy.
Current usage metrics show cumulative count of Article Views (full-text article views including HTML views, PDF and ePub downloads, according to the available data) and Abstracts Views on Vision4Press platform.
Data correspond to usage on the plateform after 2015. The current usage metrics is available 48-96 hours after online publication and is updated daily on week days.
Initial download of the metrics may take a while.