Fig. 3
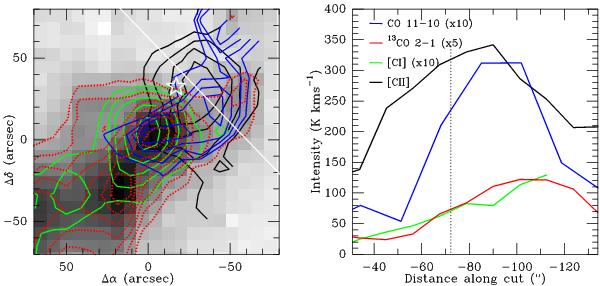
Left: map of integrated intensity distributions of 13CO 2–1 (greyscale, red contor), [C ii] (black), CO 11–10 (blue), and [C i] (green). Right: cut through the [C ii] peak and the CO 11–10 peak #2. The black dotted vertical line denotes the position closest to the B1 star along the cut. Integration ranges: [C ii] and [C i] [ − 20; − 5], CO 11–10, and 13CO [ − 17; − 10] ( km s-1).
Current usage metrics show cumulative count of Article Views (full-text article views including HTML views, PDF and ePub downloads, according to the available data) and Abstracts Views on Vision4Press platform.
Data correspond to usage on the plateform after 2015. The current usage metrics is available 48-96 hours after online publication and is updated daily on week days.
Initial download of the metrics may take a while.