Fig. 1
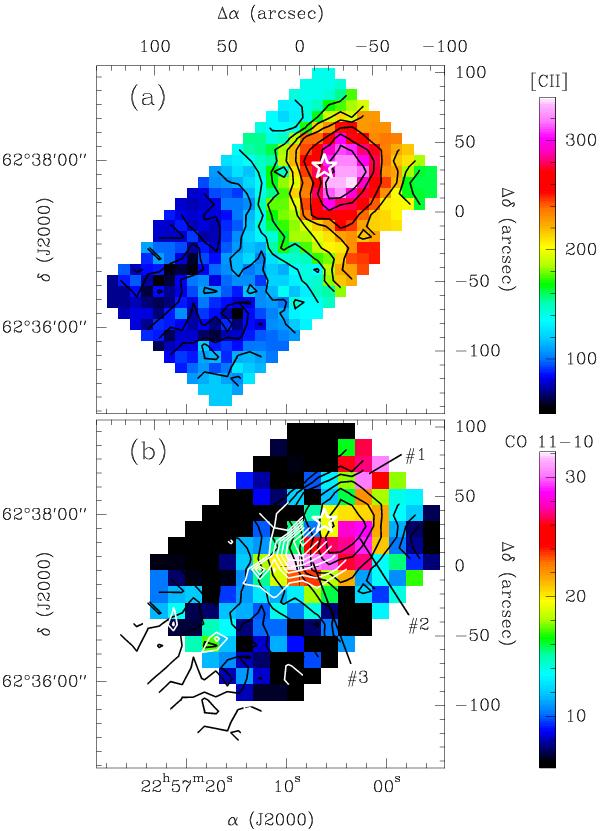
a) Velocity-integrated intensity map of [C ii] in color and contors. The contor levels are at 79 to 339.4 K km s-1 (peak) in steps of 29 K km s-1. b) Integrated intensity map of CO 11–10 (color) overlayed with contors of CO 13–12 (white) and [C ii] (black) intensities. Contour levels for CO 13–12 are: 2.1 to 11.7 K km s-1 (peak). vLSR-range of integration is [C ii]: [ − 20; − 5], CO: [ − 16; − 11] km s-1. The white star denotes the B1 star at (α;δ) = (22h57m6.2s;62°37′55.4″). Offsets of the marked CO peaks #1, #2, and #3 are ( − 45′′, +64′′), ( − 41′′, +20′′), and ( − 9′′, +3′′), respectively.
Current usage metrics show cumulative count of Article Views (full-text article views including HTML views, PDF and ePub downloads, according to the available data) and Abstracts Views on Vision4Press platform.
Data correspond to usage on the plateform after 2015. The current usage metrics is available 48-96 hours after online publication and is updated daily on week days.
Initial download of the metrics may take a while.