Fig. 3
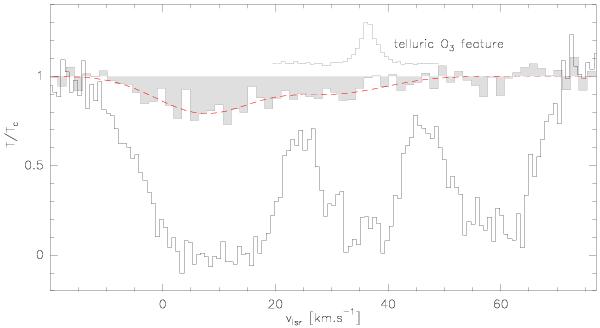
18OH absorption (top, grey-shaded), a least-squares, two-component fit to it (dashed line) and OH absorption towards W49N. The spectra are scaled by the corresponding continuum level, to facilitate a comparison. The insert at the top shows a telluric ozone feature (as observed in total power), where the calibration is more uncertain.
Current usage metrics show cumulative count of Article Views (full-text article views including HTML views, PDF and ePub downloads, according to the available data) and Abstracts Views on Vision4Press platform.
Data correspond to usage on the plateform after 2015. The current usage metrics is available 48-96 hours after online publication and is updated daily on week days.
Initial download of the metrics may take a while.