Free Access
Fig. 1
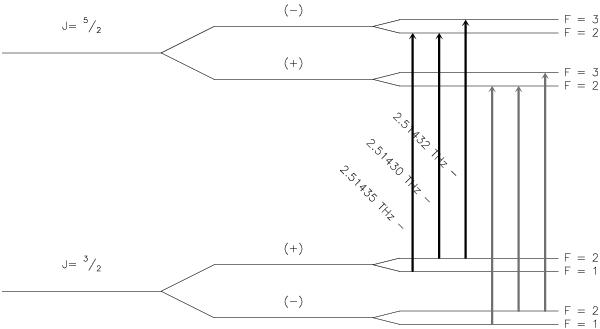
Level diagram (not to scale) for the  OH ground and first excited state. The observed 16OH transitions are indicated by bold arrows and labelled with their corresponding frequency. The observed 18OH transitions are drawn as grey arrows.
Current usage metrics show cumulative count of Article Views (full-text article views including HTML views, PDF and ePub downloads, according to the available data) and Abstracts Views on Vision4Press platform.
Data correspond to usage on the plateform after 2015. The current usage metrics is available 48-96 hours after online publication and is updated daily on week days.
Initial download of the metrics may take a while.