Fig. 1
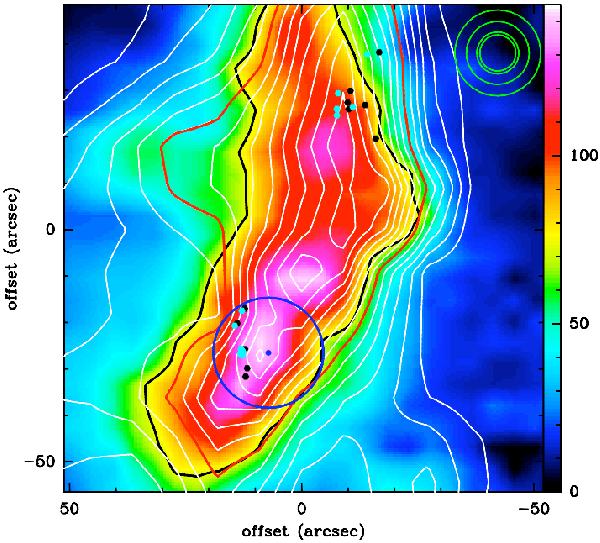
Overlay of the velocity-integrated CO (6–5) (colour background) with the CO (3–2) (white contours) emission observed with the APEX telescope. For both lines, the intensity was integrated between –30 and 40 km s-1. The wedge unit is K km s-1 in antenna temperature. The CO (3 − 2) contours are from 30 to 160 σ, in steps of 10σ = 16 K km s-1. The half-maximum contours of the CO (3 − 2) and (6–5) maps are indicated in red and black, respectively. The dark blue circle indicates the position and beam size of the SOFIA/GREAT observations. The APEX beam sizes of our CO (3 − 2), (4–3), (6–5), and (7 − 6) observations are also provided (upper right corner light green circles, see also Table A.1). The maps are centred at (RA[J2000] =  , Dec[J2000] = −23°19′25″). The black and light blue hexagons mark the position of the OH masers observed by Claussen et al. (1997) and Hoffman et al. (2005).
Current usage metrics show cumulative count of Article Views (full-text article views including HTML views, PDF and ePub downloads, according to the available data) and Abstracts Views on Vision4Press platform.
Data correspond to usage on the plateform after 2015. The current usage metrics is available 48-96 hours after online publication and is updated daily on week days.
Initial download of the metrics may take a while.